Traders must wait for this before placing long bets on Bitcoin

The Bitcoin market has had its ups and downs over the past couple of months. In a constant effort to combat selling pressure, the king coin’s price has been unable to climb past several key levels to alleviate fears of a prolonged bear market. While sellers have been relentless in the market, a key development has emerged since 19 May sell-off. The $29,600-$30,000 range held strong after yet another wave of selling pressure and triggered another BTC rally. At the time of writing, BTC traded at $34,732, up by 2.8% over the last 24 hours.
BTC 4-hour chart
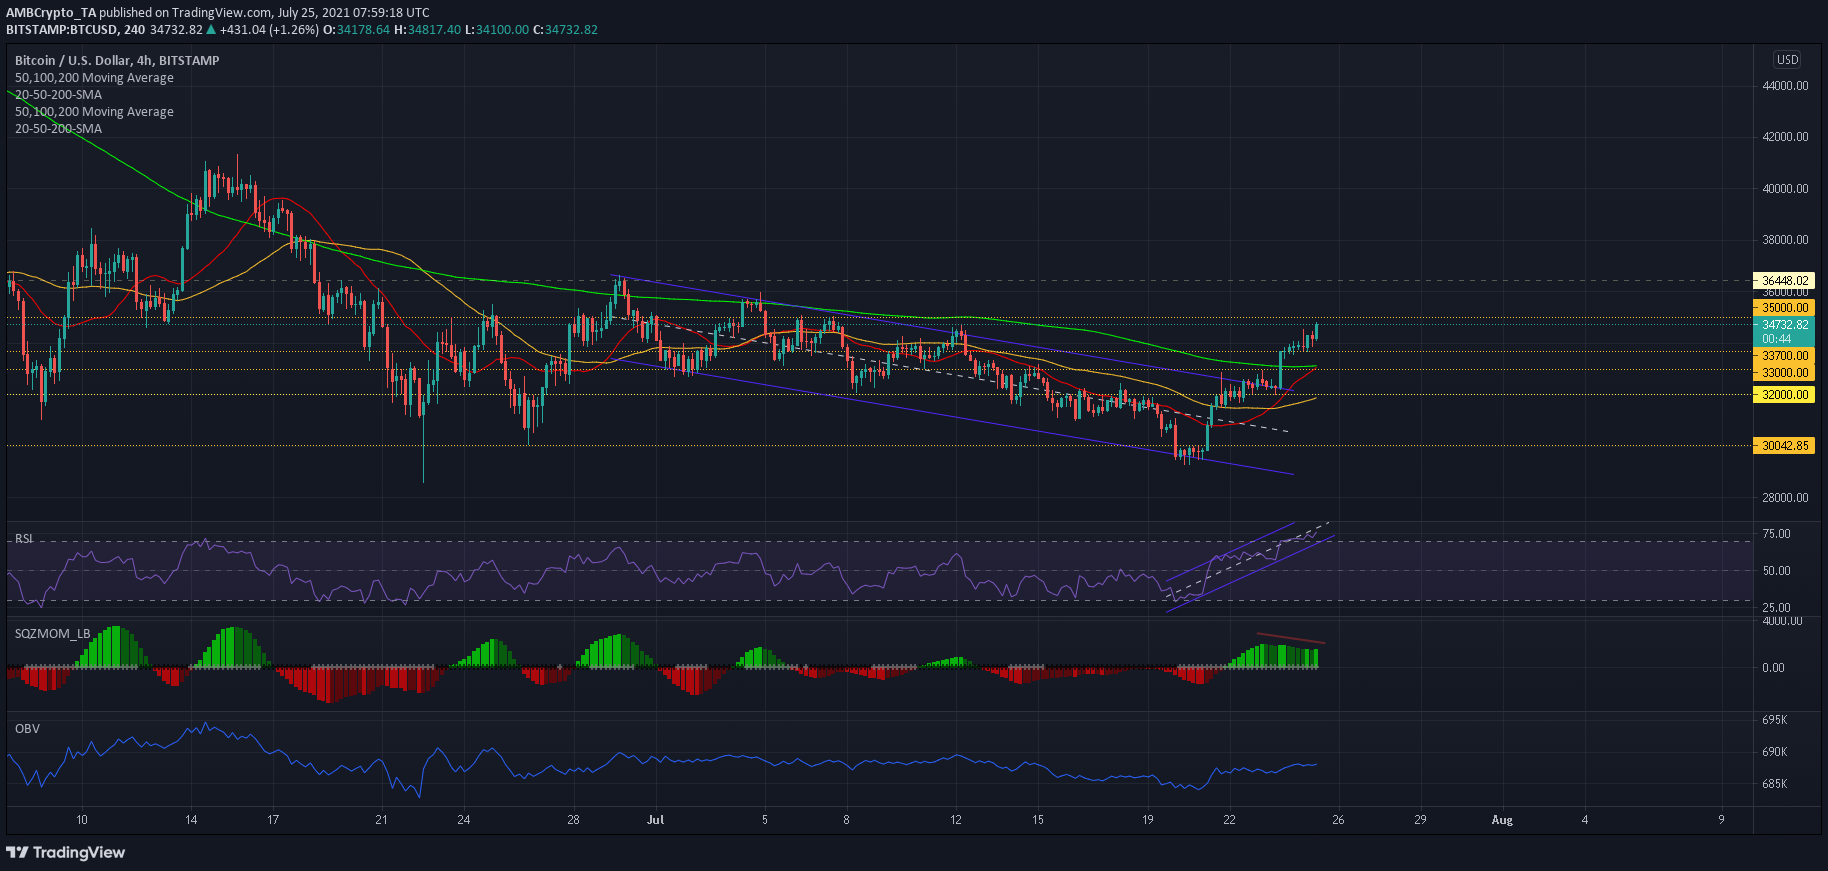
BTC’s breakout from its descending channel saw prices move above their 4-hour 200-SMA for the first time since late-June. Taking advantage of bullish sentiment in the market, buyers were even able to sustain the price above their long term moving average as BTC pushed higher on the charts. The next crucial resistance mark now lay at $35,000 but an upwards breakout seemed unlikely especially since the 24-hour trading volumes diminished by 13%.
Daily 50-SMA to stall BTC’s uptrend?
Switching over to the daily chart (not shown), BTC’s 50-SMA, which has run bearish since 19 May, rested close to $35,000-resistance. The mid-term moving average line could come into play and deny any short-term upside- a development that could see BTC trade just below $34,000 in the coming sessions. In case of a minor correction, BTC’s next defense rested at a support zone of $33,000-$33,700.
Reasoning
The Relative Strength Index has moved within an up-channel since 20 July and now traded in the overbought zone. This indicated that BTC could see some southbound action and reset before continuing its upwards trajectory. While still above the half,-line, Squeeze Momentum Indicator noted a decline in bullish momentum and formed a slight bearish divergence. However, BTC’s current uptrend might still be intact as buying pressure was on the up- something pointed out by On Balance Volume’s northbound movement.
Conclusion
Bullish momentum might fizzle out as BTC approached its next crucial resistance mark of $35,000- an area strengthened by the daily 50-SMA. Trading volumes took a dip as BTC approached this barrier- a finding that could result in some sideways movement. Meanwhile, traders were advised to play safe and wait for BTC to approach a stronger support level before placing any long trades.