Traders who missed out on Tezos’ bull run can long here

Disclaimer: The findings of the following analysis are the sole opinions of the writer and should not be taken as investment advice
As the weekend approached, most alts in the top 50 struggled to expand their recovery after Bitcoin dropped to $45,000. A few anomalies such as Polkadot and Kusama surprised the market with decent gains, but Tezos seemed to be leading by example.
XTZ registered another 33% hike and formed a new local top at $6.4. Bullish sentiment also ran high after American rapper Doja Cat launched an NFT collection on the Tezos platform a few days ago. However, a deeper dive into the hourly chart suggested that some profit-taking had started to kick in.
Tezos Hourly Chart
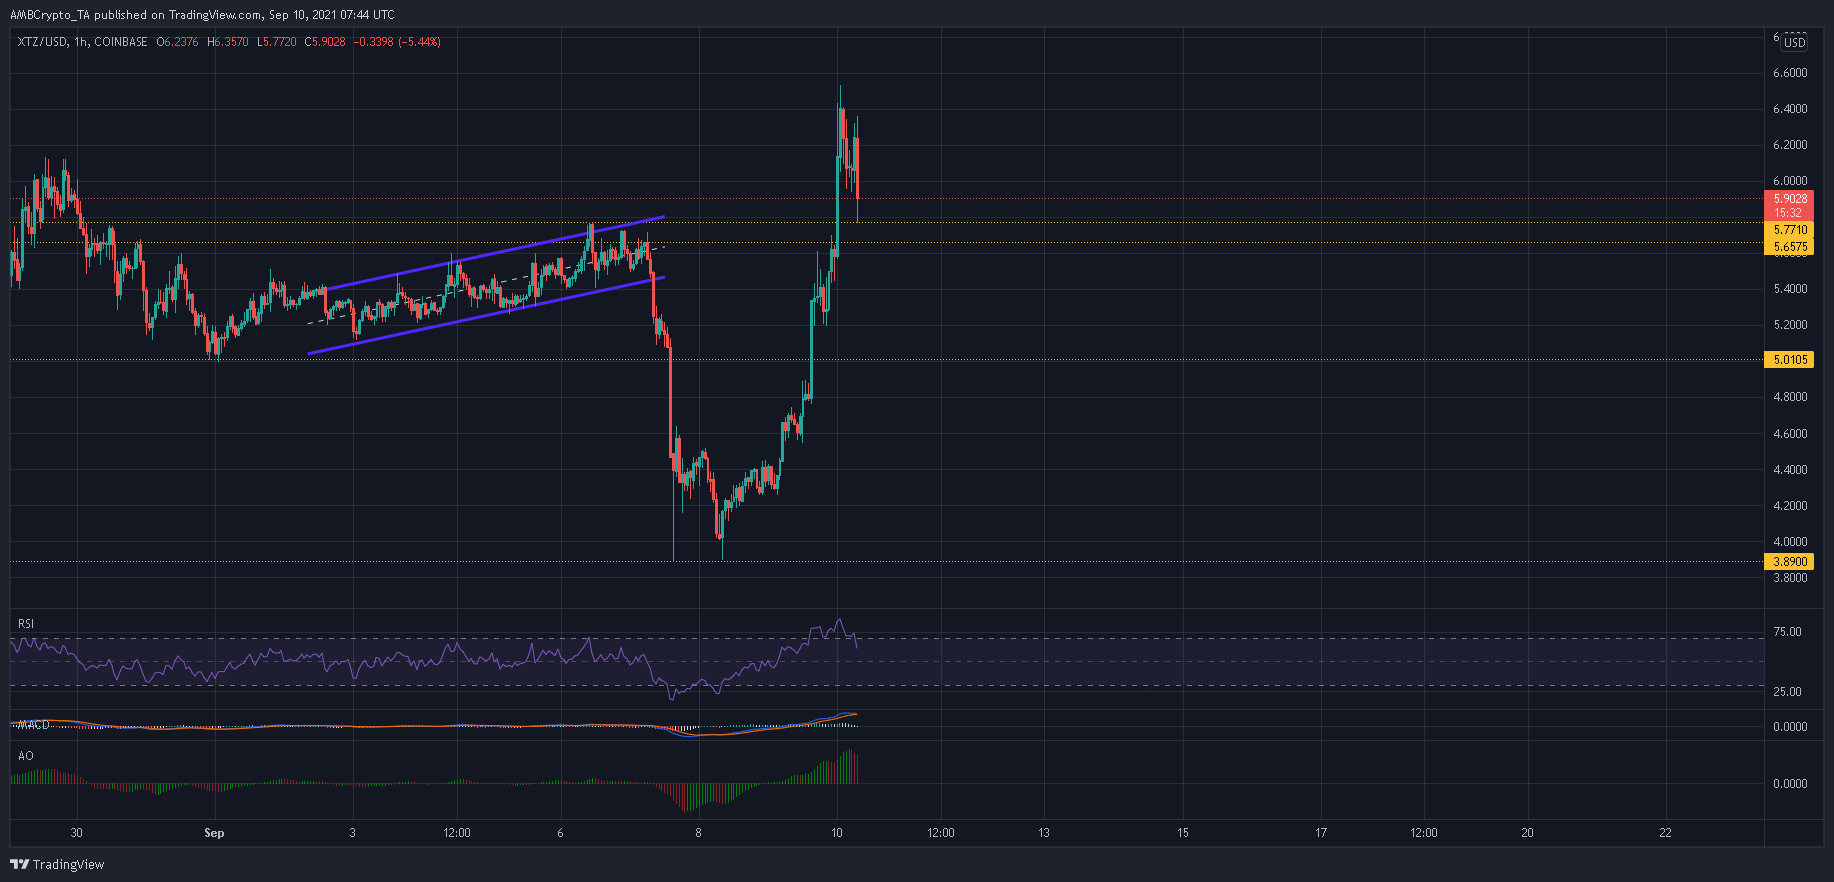
Like most of its counterparts, XTZ fell prey to a wider market sell-off on 7 September. Since this also coincided with XTZ’s up-channel breakdown, losses amounted to nearly 30% from the bottom trendline. A few candlewicks even dropped as low as $3.88, marking a 2-wk low for the digital asset.
Interestingly, the $2.88 region held much importance in the XTZ market. The support line had triggered multiple rallies ranging from February to March. The most recent jump came just a week ago after XTZ’s impulsive drop from $4.5 to the aforementioned support.
What resulted was a 40% spike towards $5.4. Such was the case once again as buyers responded promptly to XTZ’s breakdown.
On the downside, the last few hours did see some choppy movement. High volatility accounted for some losses as XTZ dropped from $6.4 to its press time level of $6. If sellers do press forward, the defensive zone of $5.65-$5.77 would be the best bet to aid XTZ’s near-term movement.
The support line of $4.54 could also be called into action if downwards pressure fails to extinguish. Conversely, a close below an important support level at $5 could be damaging to XTZ’s bullish structure.
Reasoning
All of XTZ’s indicators were easing from extreme levels. Buying pressure was gradually receding on the MACD and a bearish crossover loomed large. The Awesome Oscillator, which traded at a multi-month high, also registered a series of red bars.
Meanwhile, the RSI cooled off from overbought levels and was heading towards the half-line. Such a reading would actually be healthy over the long run as it would allow XTZ to stabilize before the next upswing.
Conclusion
XTZ seemed to be looking at a few support lines to trim incoming losses. This would allow its indicators to reset before the next wave of buying pressure hits the market. Meanwhile, traders can long at the aforementioned support regions to capitalize on the next upswing.
However, traders must also be cautious of a close below $5 as this would invite short-sellers to the market.