Tron, Aave, Compound Price Analysis: 03 February

Tron was trading within an ascending triangle at the time of writing, but the indicators did not favor a breakout over the next few trading sessions. Aave flashed bullish signals and looked to snap newer highs on the charts while COMP was projected to rise above record levels after a bullish divergence formed on the RSI.
Tron [TRX]
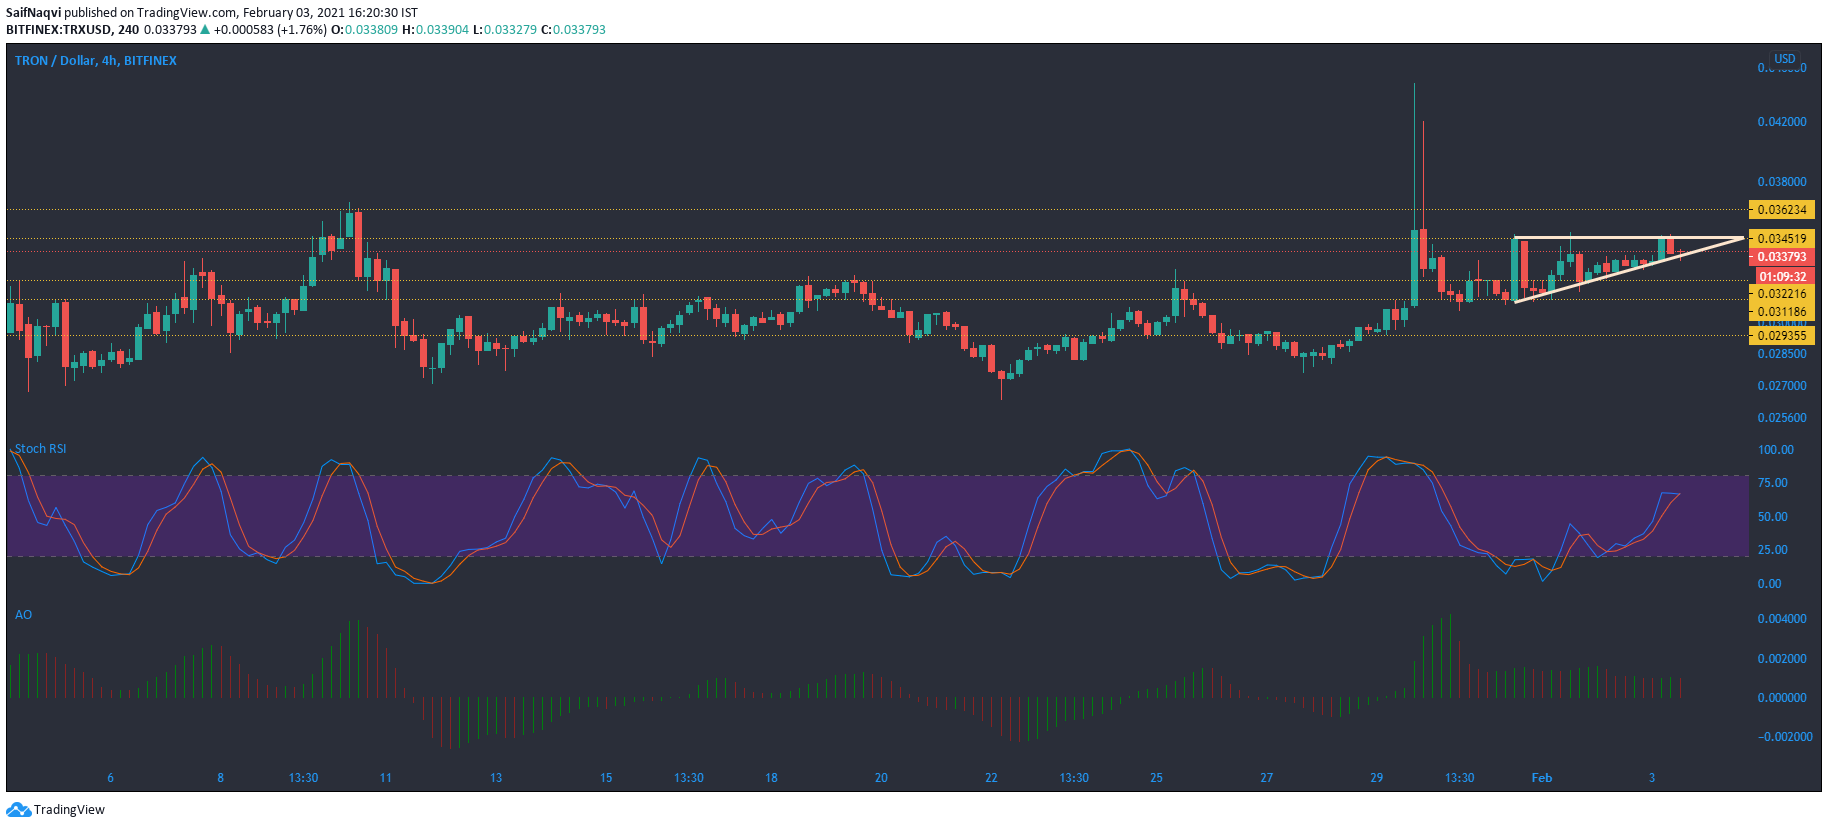
Tron was rejected at the $0.034-price level as the price moved towards the lower end of the ascending triangle. While the price typically witnesses a breakout above this pattern, low trading volumes mean that the price could continue to move within these trendlines over the next few sessions. However, a surge in buying activity could push TRX above the upper trendline and towards the $0.036-resistance.
At press time, the Stochastic RSI was on the verge of a bearish crossover, while the Awesome Oscillator registered a single point of bearishness. A southbound breakout from the triangle could see TRX move below the $0.031-support.
Aave [AAVE]
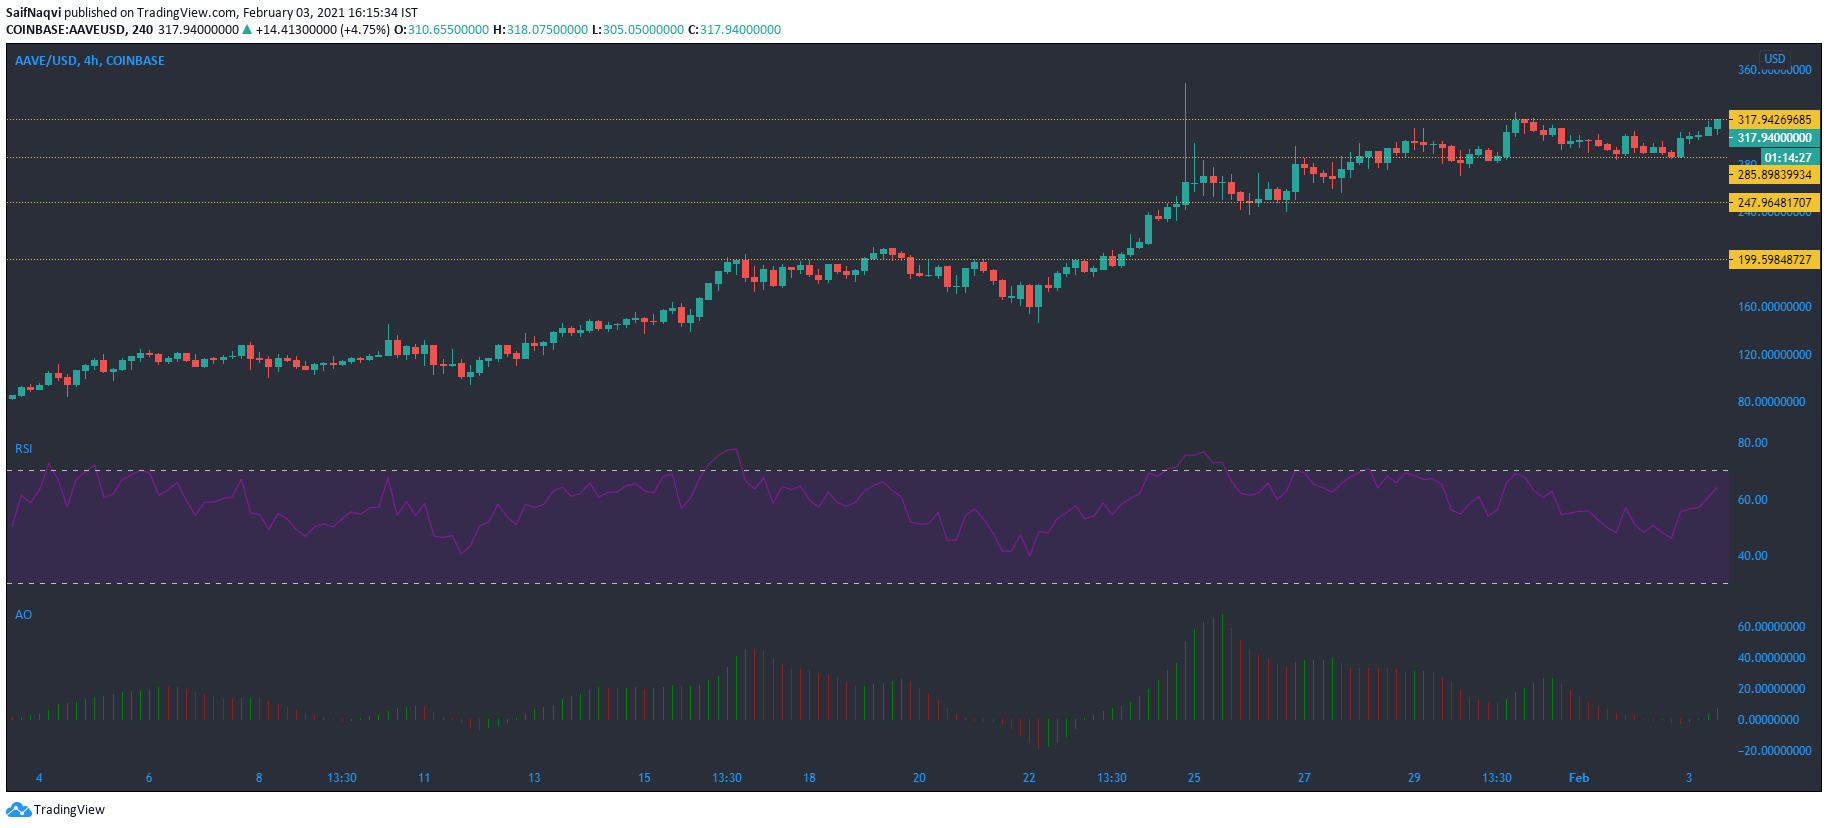
Aave bounced back from the support at $285.8 as the price traded close to record levels. The hike over the last 24 hours was backed by an uptick in trading volume and healthy buying activity. A move above the $317-resistance level could see AAVE snap a fresher all-time high. This was supported by a bullish Relative Strength Index, with the same not yet at its tipping point.
The Awesome Oscillator pictured the onset of bullish momentum in the market, with the indicator’s histogram flashing green, at press time.
Compound [COMP]
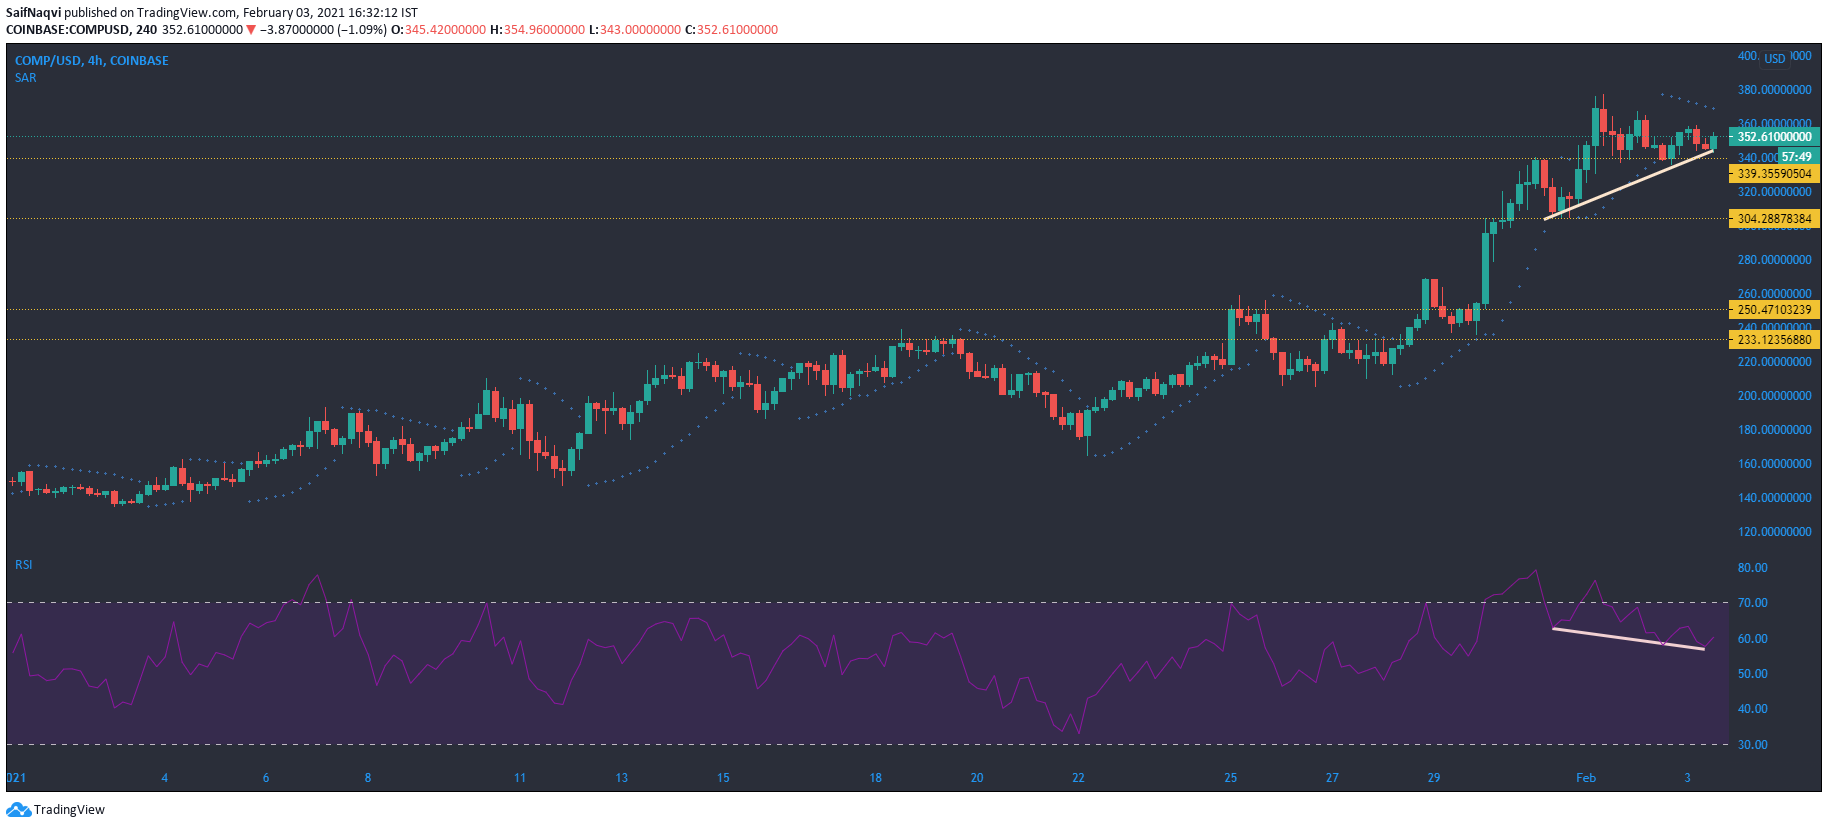
Although Compound performed impressively on the charts and posted gains of over 50% in the last seven days, some consolidation was seen at the time of writing as trading volumes contracted by 24%. However, a bullish divergence was spotted on the Relative Strength Index, which suggested a rise towards record levels once again.
On the other hand, the Parabolic SAR’s dotted markers moved above the candlesticks and projected a downtrend. The market’s bulls might struggle to hold the price above the $339.3-support in case of a sharp pullback for COMP.


