TRON: All you need to know about this high-risk area for traders

Disclaimer: The findings of the following analysis are the sole opinions of the writer and should not be considered investment advice
Over the past two days, the Bitcoin Dominance metric has noted an increase from 42.9% to 43.43%. This is a sign that Bitcoin has been performing slightly better (or posting slightly lower losses) than the rest of the market.
TRON has also oscillated as per the whims of Bitcoin on the charts recently. However, it has faced resistance in the $0.06-$0.065 area and TRON is now trading within this area once again.
TRX- 1 hour chart
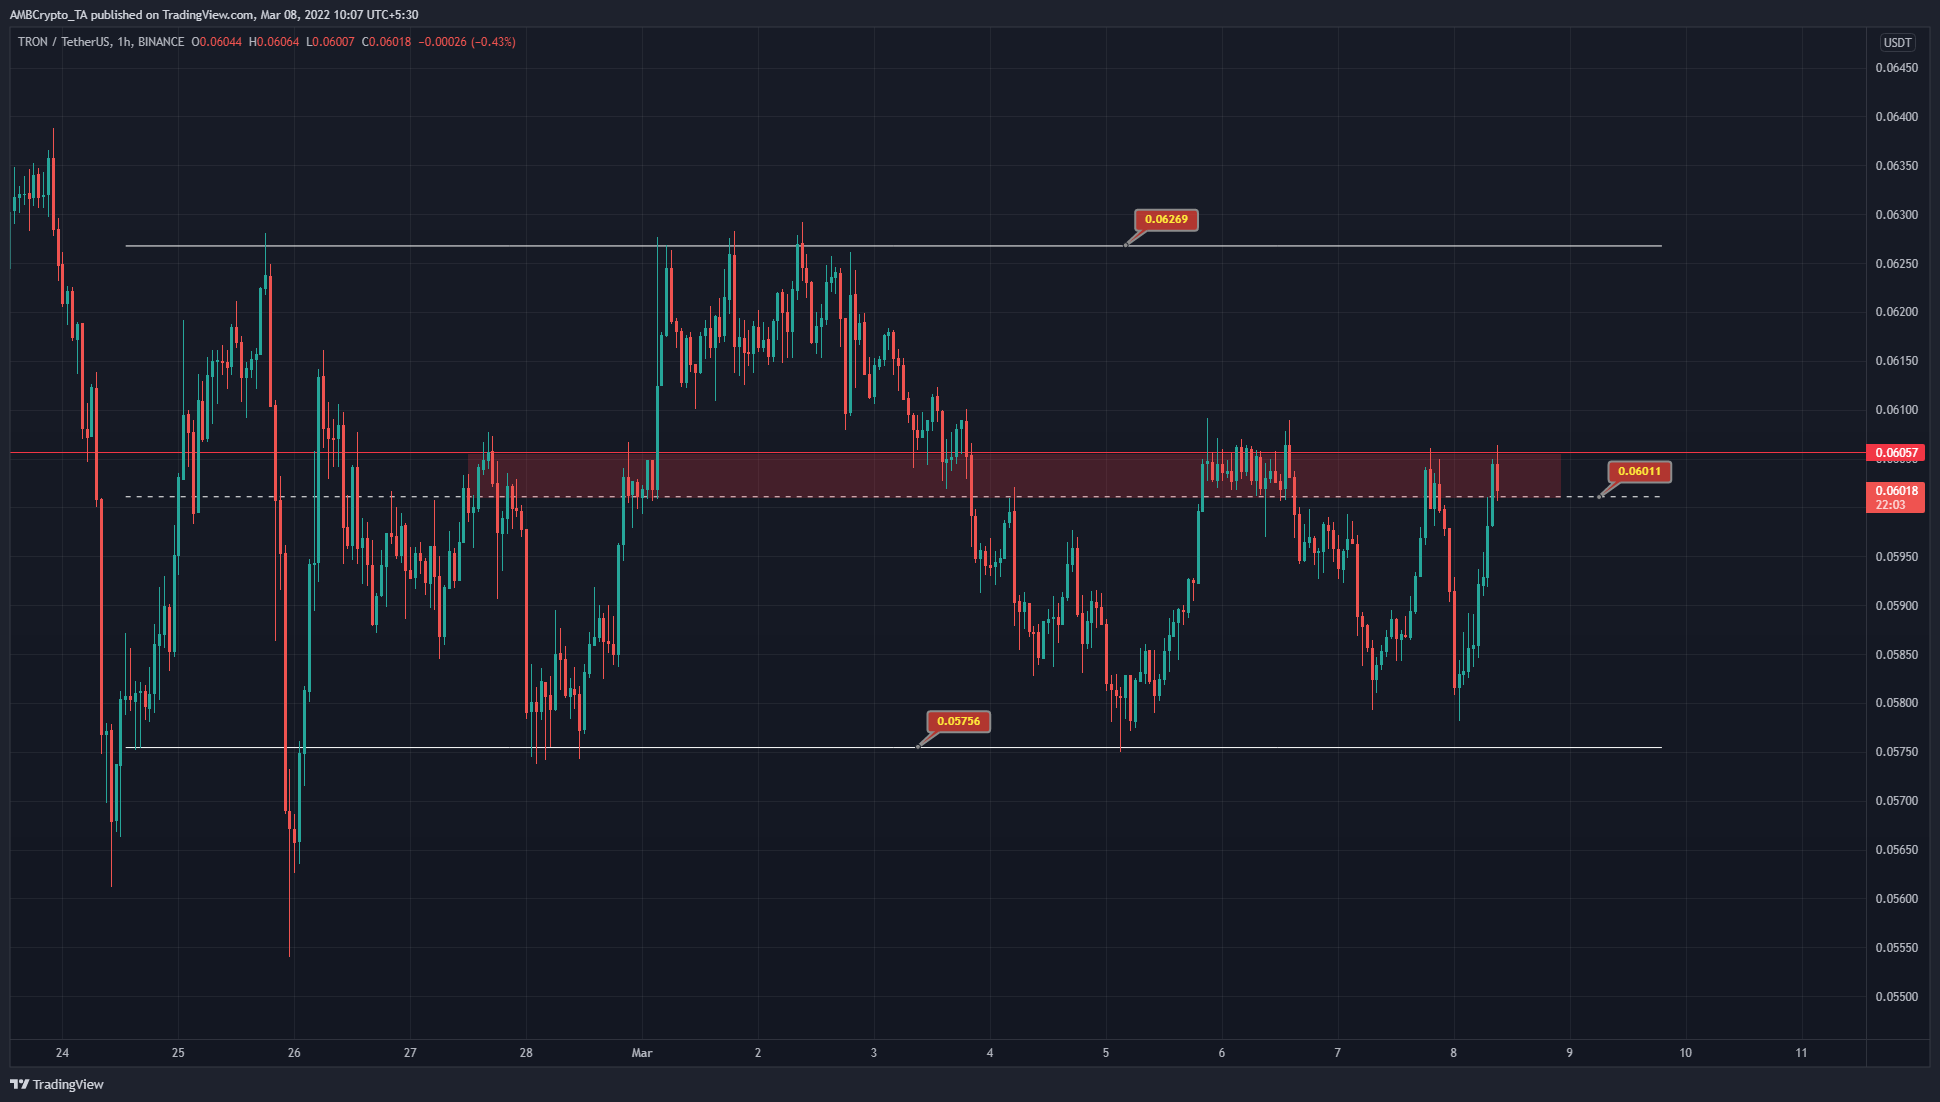
Over the past ten days or so, TRX has formed a range between $0.0575 and $0.0626. There have been significant deviations beneath $0.0575 but these could have been the result of liquidity hunts. The mid-point of this range (white, dotted) has served as temporary support and resistance over the past two weeks.
Hence, the range structure held some water in the short term. Alongside the mid-range value at $0.06, there was a longer-term horizontal resistance level at $0.0605. This area (red box) has rejected TRX multiple times recently. A clean breakout past this region has seen TRX visit the range highs.
Therefore, these are once more the two scenarios on hand for TRX. Rejection and a move to $0.058, or a few hours of sideways trading within this region followed by a spike in value to reach $0.0627. In either scenario, the risk-to-reward would not be feasible for traders of either bullish or bearish bias.
Rationale
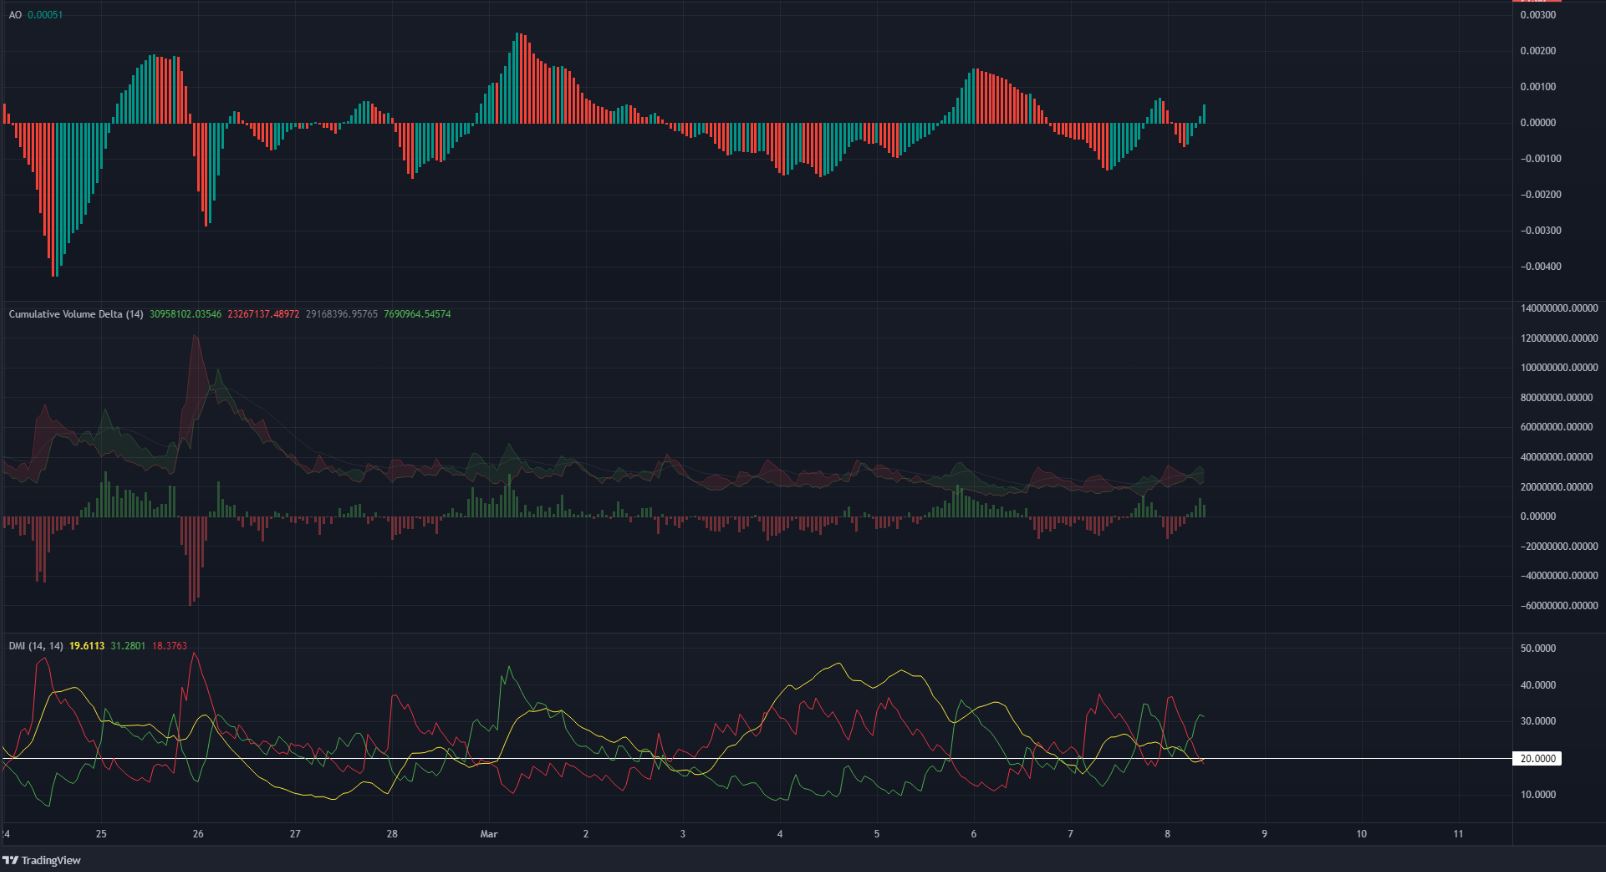
The indicators were mellow and suggested that no strong short-term trend was behind TRON’s recent price movement. The Awesome Oscillator climbed above the zero line in recent hours, but has been weaving above and below the zero line recently.
The CVD was also a similar tale – Yes, it flashed some buying pressure in the immediate hours prior to press time, but nothing significant. The Directional Movement Index highlighted the lack of a strong trend, with the ADX just below 20.
Conclusion
A revisit to the $0.056-$0.058 lows could offer a near-term buying opportunity while a test of the $0.0627 resistance could be a selling opportunity. Risk-loving traders can position themselves aggressively in the $0.06-$0.0605 zone while risk-averse traders can wait for a more certain opportunity.