Tron, Augur, Zcash Price Analysis: 13 February

Tron moved within an ascending triangle, but a northbound breakout did not seem likely over the next few trading sessions. Further down the crypto-ladder, even though Augur and Zcash traded around their local highs, bearish indicators meant that a correction loomed large for the altcoins moving forward.
Tron [TRX]

Source: TRX/USD, TradingView
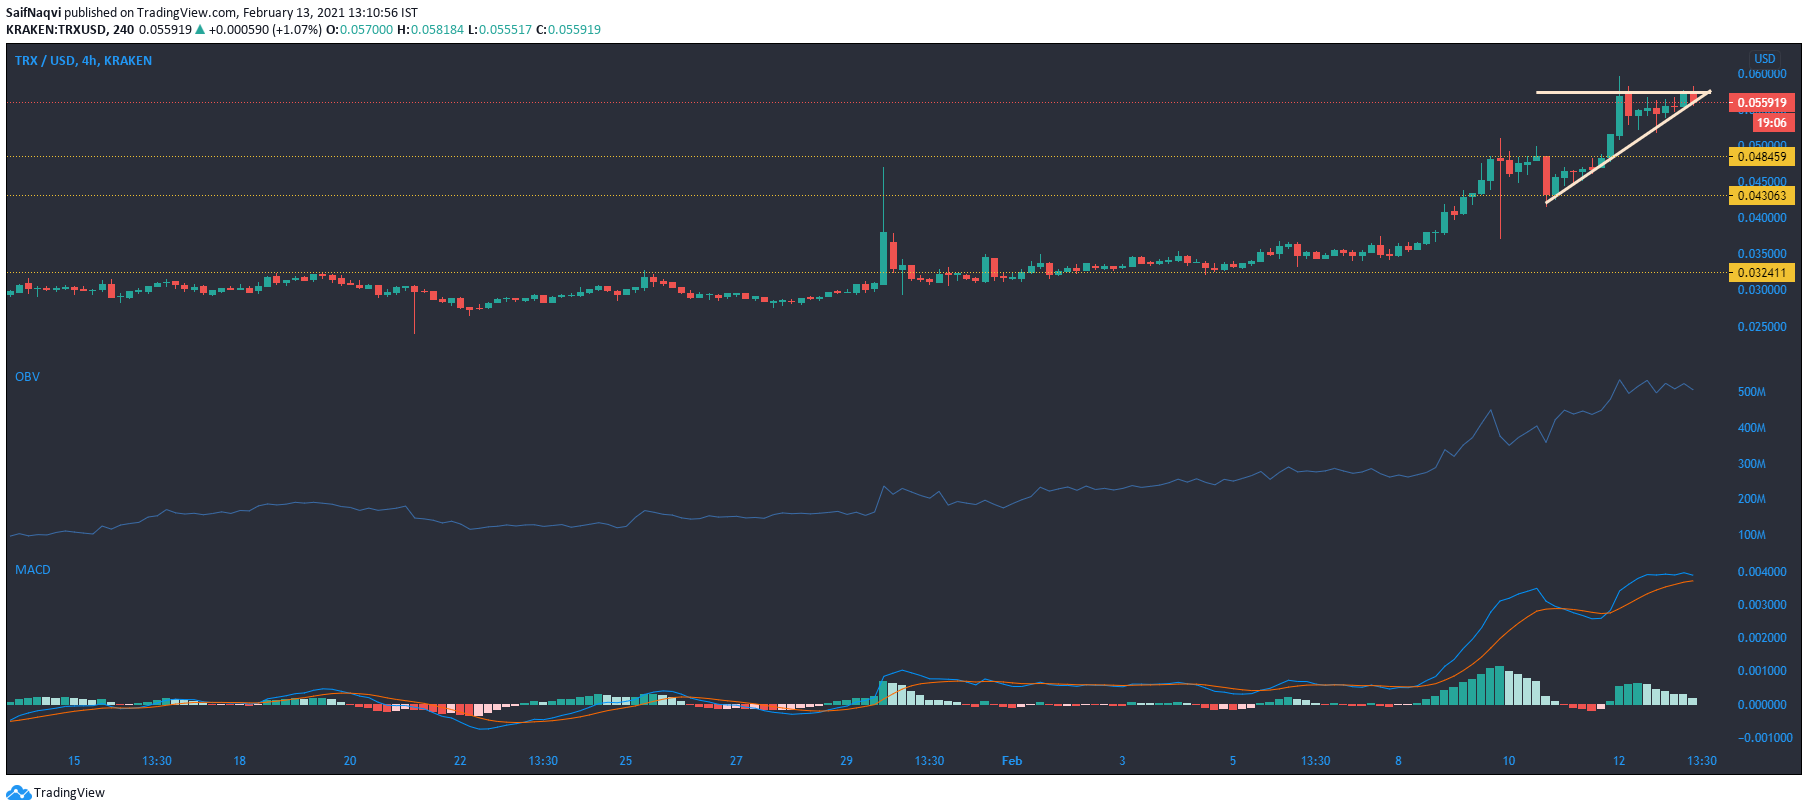
Tron touched a local high of $0.058 at the time of writing as gains over the last seven days amounted to 67%. A look at its 4-hour chart showed an ascending triangle pattern forming but the indicators supported a bearish outcome for the cryptocurrency. The MACD was nearing a bearish crossover while the OBV dipped over the last few sessions. This suggested that a northbound breakout could be delayed for a few more sessions.
On the other hand, a breakout in the opposite direction could see TRX move towards the 0.043-support level in the event of a pullback in the broader market.
Augur [REP]

Source: REP/USD, TradingView
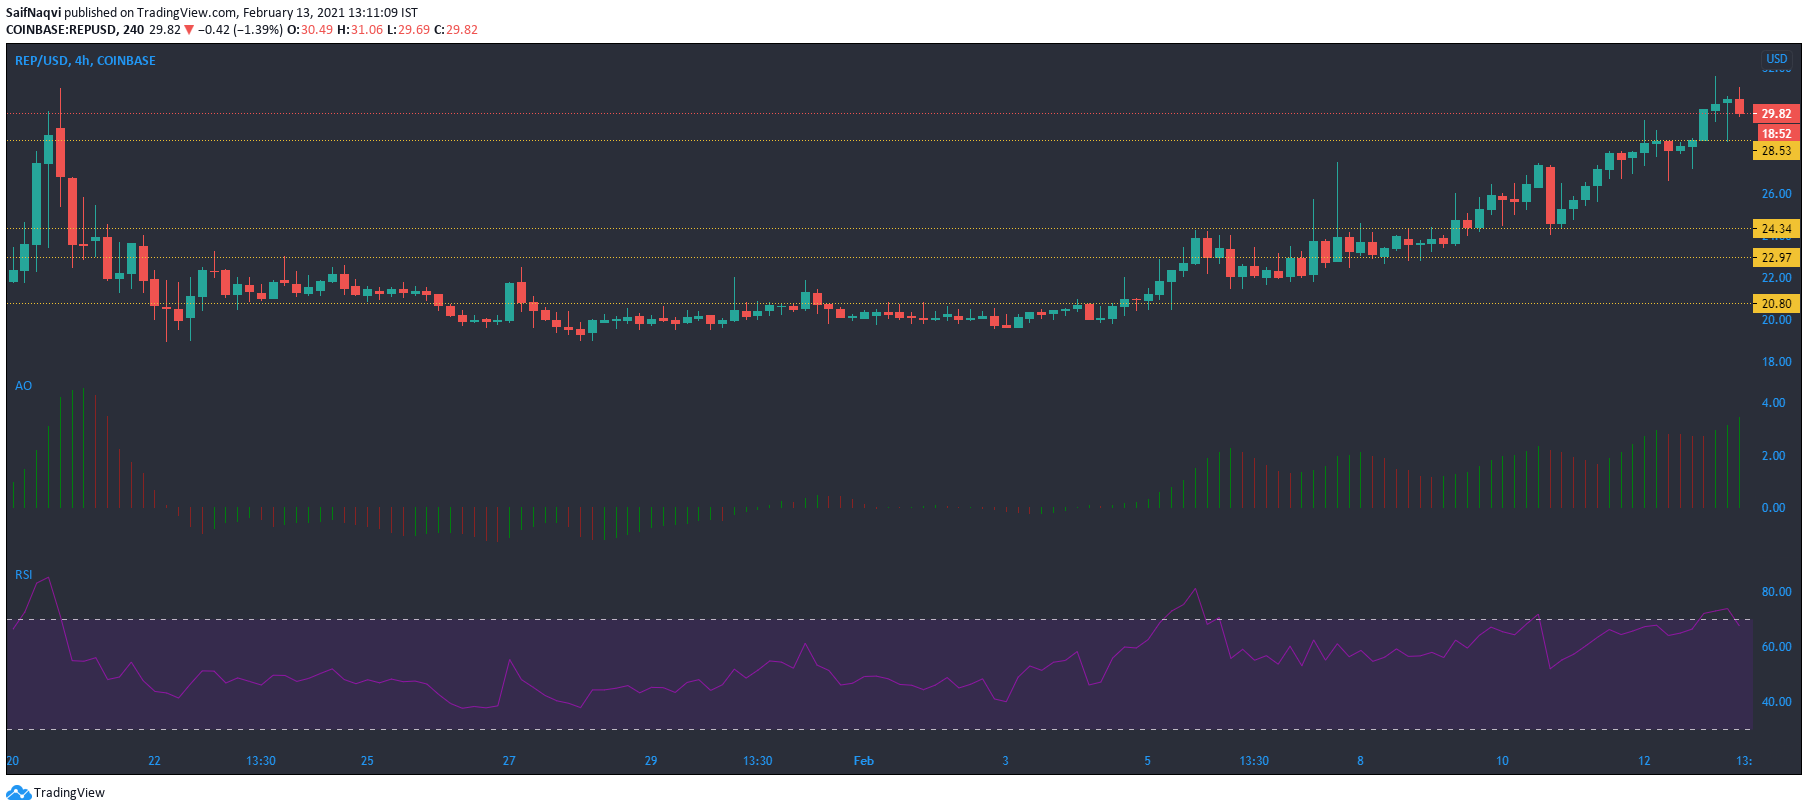
Augur touched the $30-mark after its price surged by over 5% in the last 24 hours. Its bullish momentum was highlighted by the green bars on the histogram of the Awesome Oscillator. However, despite recent gains, some saturation was seen in REP’s market as the Relative Strength Index traded in the overbought zone and hinted at a potential reversal. Subdued trading volumes also accentuated a bearish scenario for REP in the short-term.
In the event of a fall, the support levels lay at $28.5 and $24.3.
Zcash [ZEC]

Source: ZEC/USD, TradingView
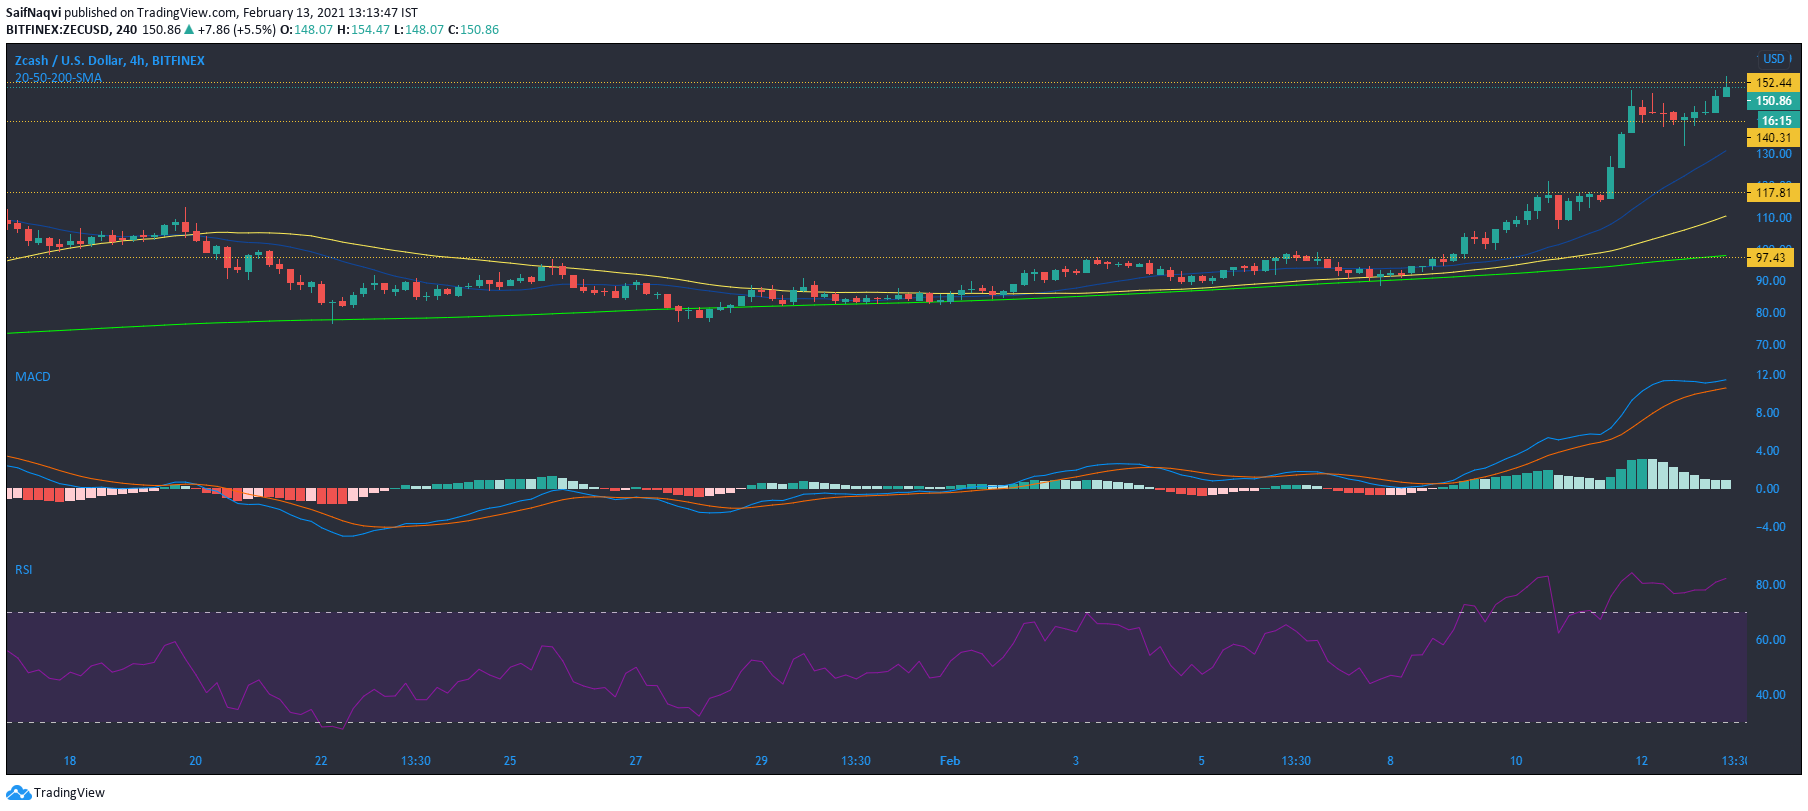
Zcash’s price has performed impressively over the last seven days, with its gains amounting to over 55%. The bullish cycle was evident on the 4-hour charts as the candlesticks moved above the 20-SMA (blue), 50-SMA (yellow), and 200-SMA(green). In fact, its recent buying activity pushed Zcash above the $150-level over the last 24-hours.
However, on-chain metrics suggested that a correction could be just around the corner as the RSI moved in the overbought zone, while the MACD highlighted a slowdown in bullish momentum. In a bearish scenario, the support levels at $140.3 and $117.8 could come under the spotlight. However, the possibility of an extended bull run cannot be discounted considering the broader market rally.


