Tron, Ethereum Classic, VeChain Price Analysis: 16 February

Tron was in danger of slipping below its 50-SMA as its indicators flashed red signals on the price charts. Ethereum Classic was projected to move within its fixed channel before an upwards breakout on the charts. Further down the crypto-ladder, VET moved within a horizontal channel, but a breakout did not seem imminent in the short-term.
Tron [TRX]

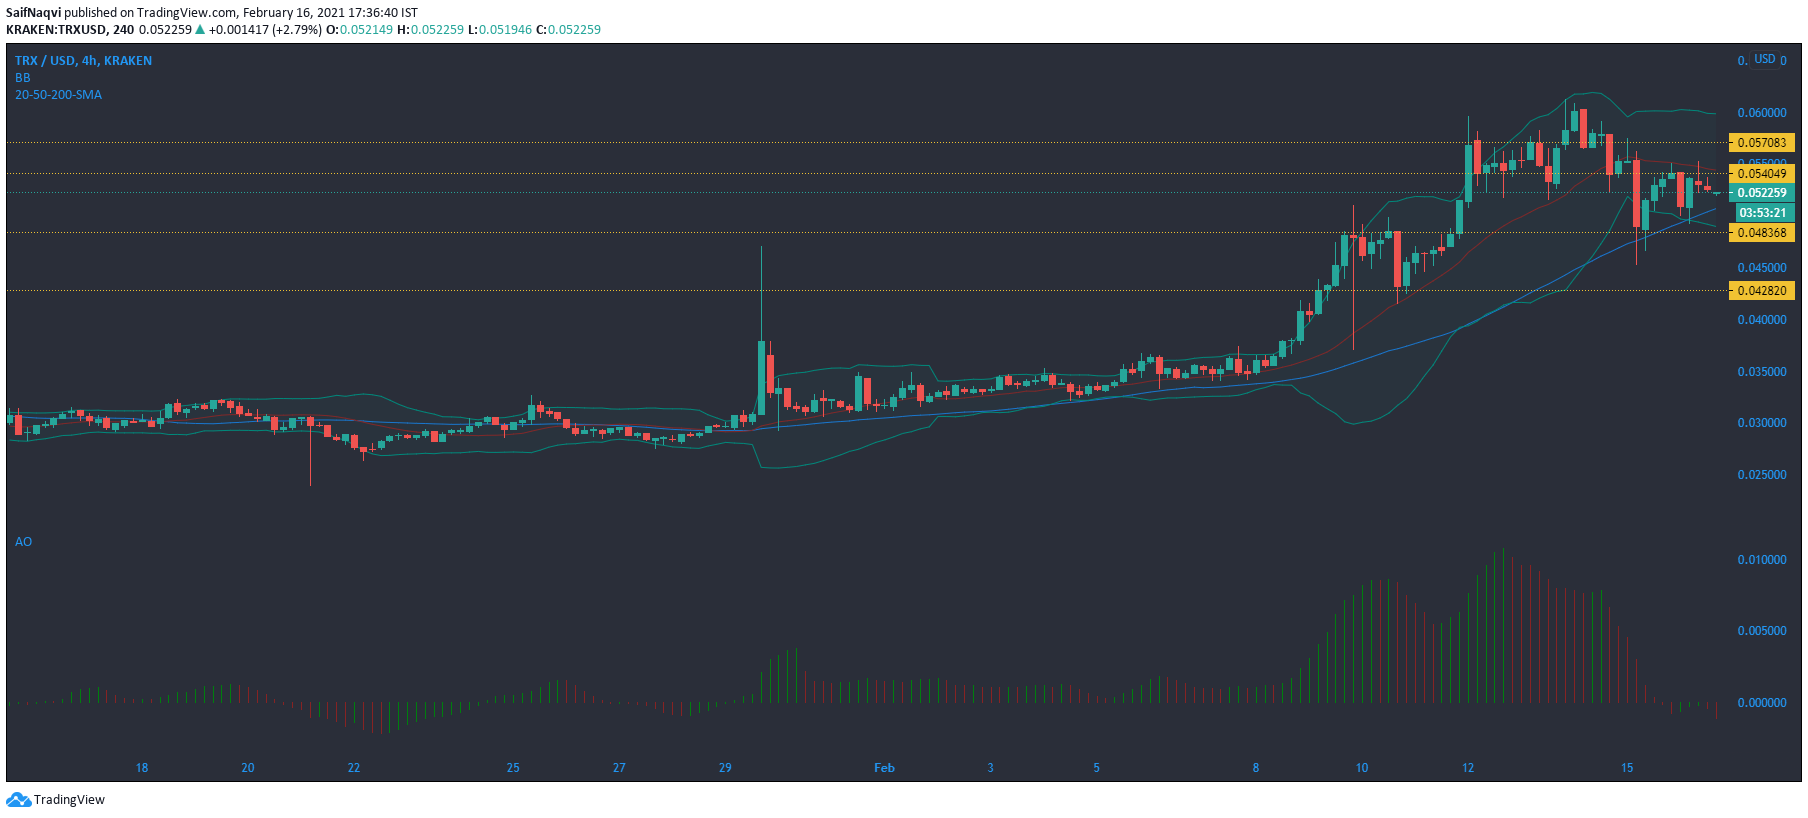
Source: TRX/USD, TradingView
The Bollinger Bands on Tron’s charts showed that the period of high volatility was likely to continue since Tron rose north of the $0.035-mark. Despite the recent strength in prices, TRX’s bulls could be in danger of losing out to the 50-SMA (blue), something that could lead to a further sell-off. The Awesome Oscillator moved below zero as momentum shifted towards the bearish side.
A fall below the 50-SMA could lead to a short-to-medium term downtrend. Conversely, a pickup in trading volumes and buying activity could see TRX rise above the $0.05-resistance.
Ethereum Classic [ETC]

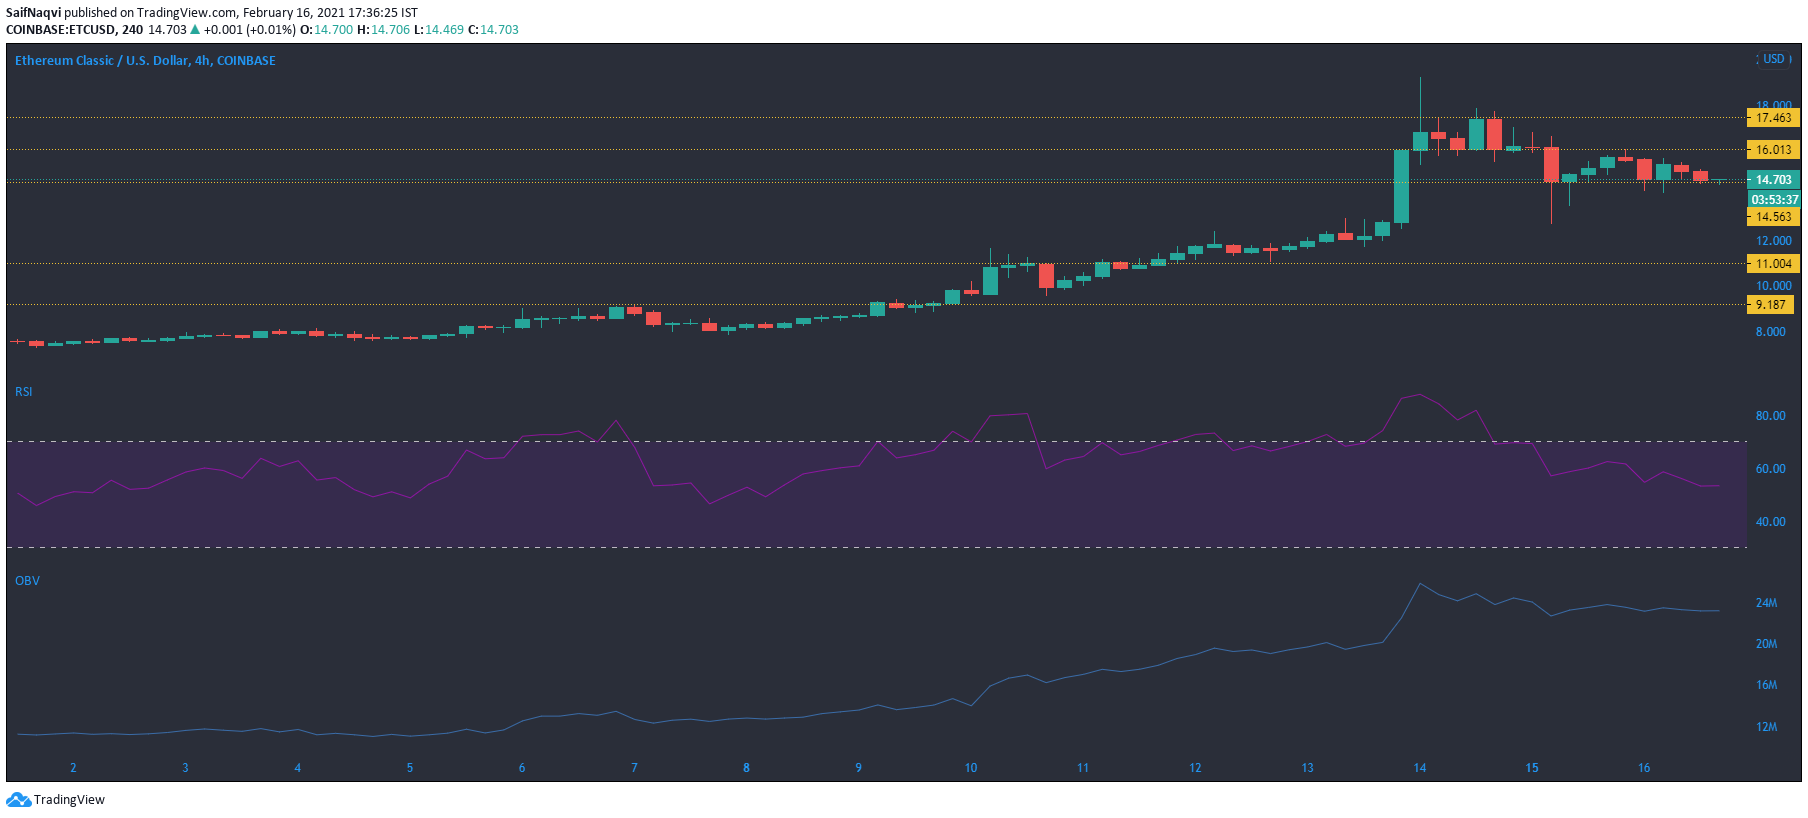
Source: ETC/USD, TradingView
Some cautiousness was noted in Ethereum Classic’s market over the last few days as the crypto’s price stabilized between its immediate support and resistance levels. The RSI was pointing slightly south around the 50-mark, while the OBV was moving flatly on the charts.
ETC’s rangebound movement could likely continue over the next few sessions as the bulls are expected to negate the press time selling pressure, considering the recent uptrend. A spike in 24-hour trading volumes could also see ETC break above its overhead resistance level.
VeChain [VET]

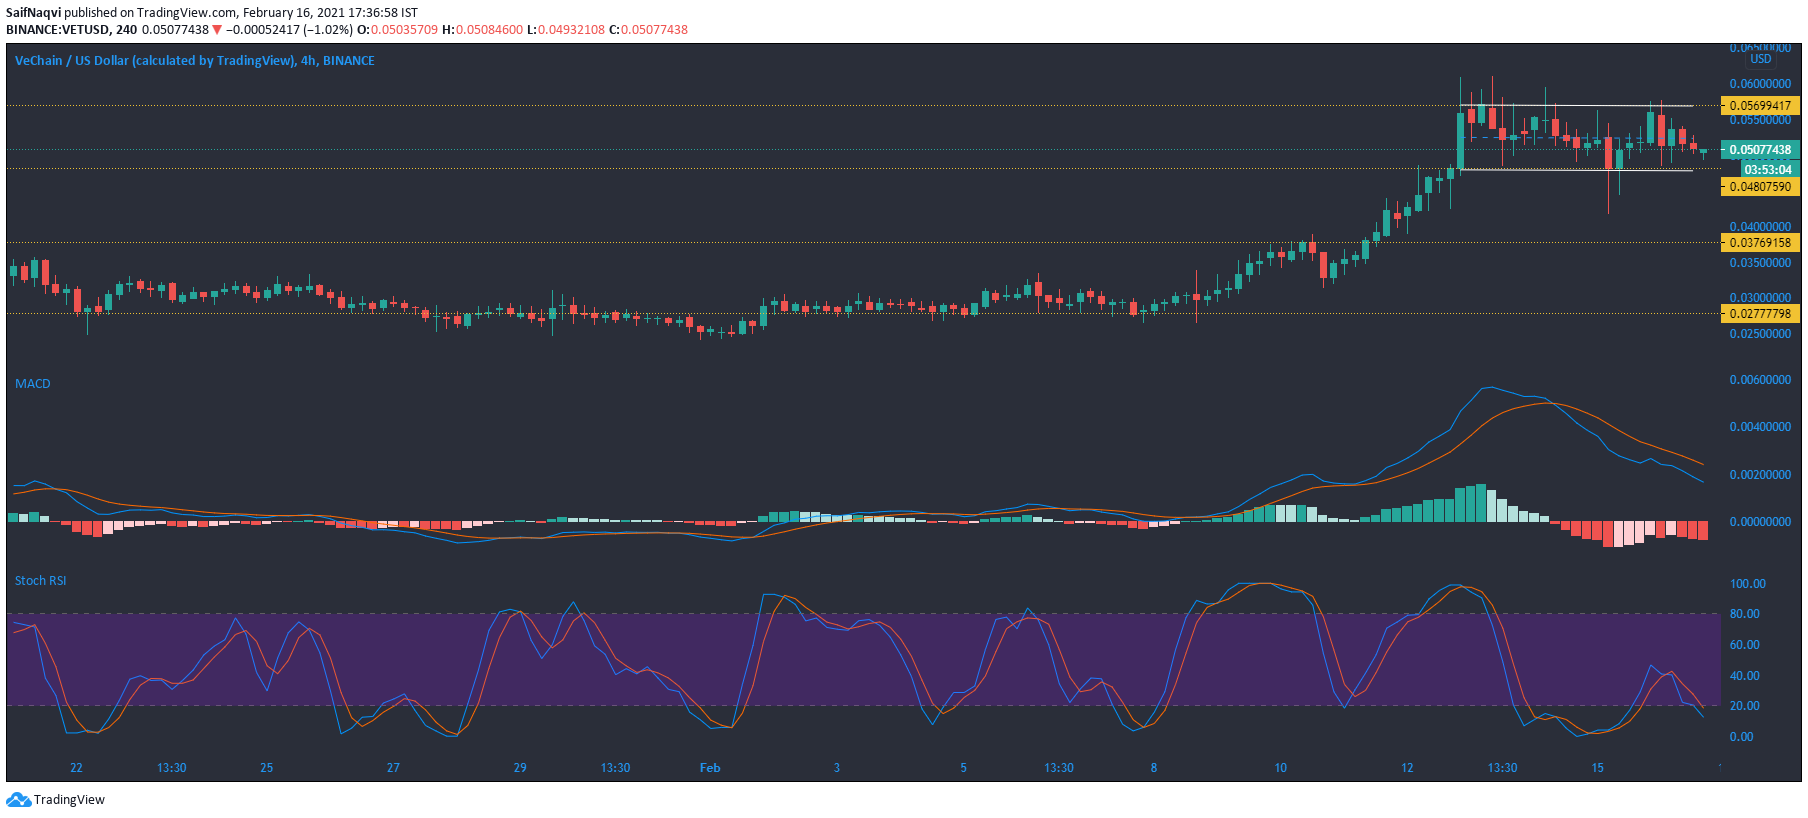
Source: VET/USD, TradingView
The formation of a horizontal channel on VeChain’s 4-hour chart showed near equal buying and selling pressure since the price snapped a $0.06 ATH. The indicators, however, noted some bearishness at the time of writing. The MACD line continued to move below the signal line, while the Stochastic RSI eyed the oversold zone.
Despite flashing red signals, the bulls could hold out to the lower trendline considering the bullish rally over the last 30 days. If the price does breach the lower trendline, a sell-off could see VET move south to the $0.037-support level.


