Tron: Gauging TRX’s potential to offer any near-term buying opportunities

Disclaimer: The findings of the following analysis are the sole opinions of the writer and should not be considered investment advice.
For nearly two months, Tron [TRX] took a sideways track while maintaining its oscillation in the $0.0709-$0.063 range. The recent reversal from its ceiling gave the sellers enough thrust to pull the coin below its 200 EMA (green).
A reversal could be plausible if the bulls repeat their empirical inclinations to rebound from the $0.06 zone. A jump above the current pattern could aid the near-term comeback chances before a likely pullback. At press time, TRX was trading at $0.06553.
TRX 4-hour Chart
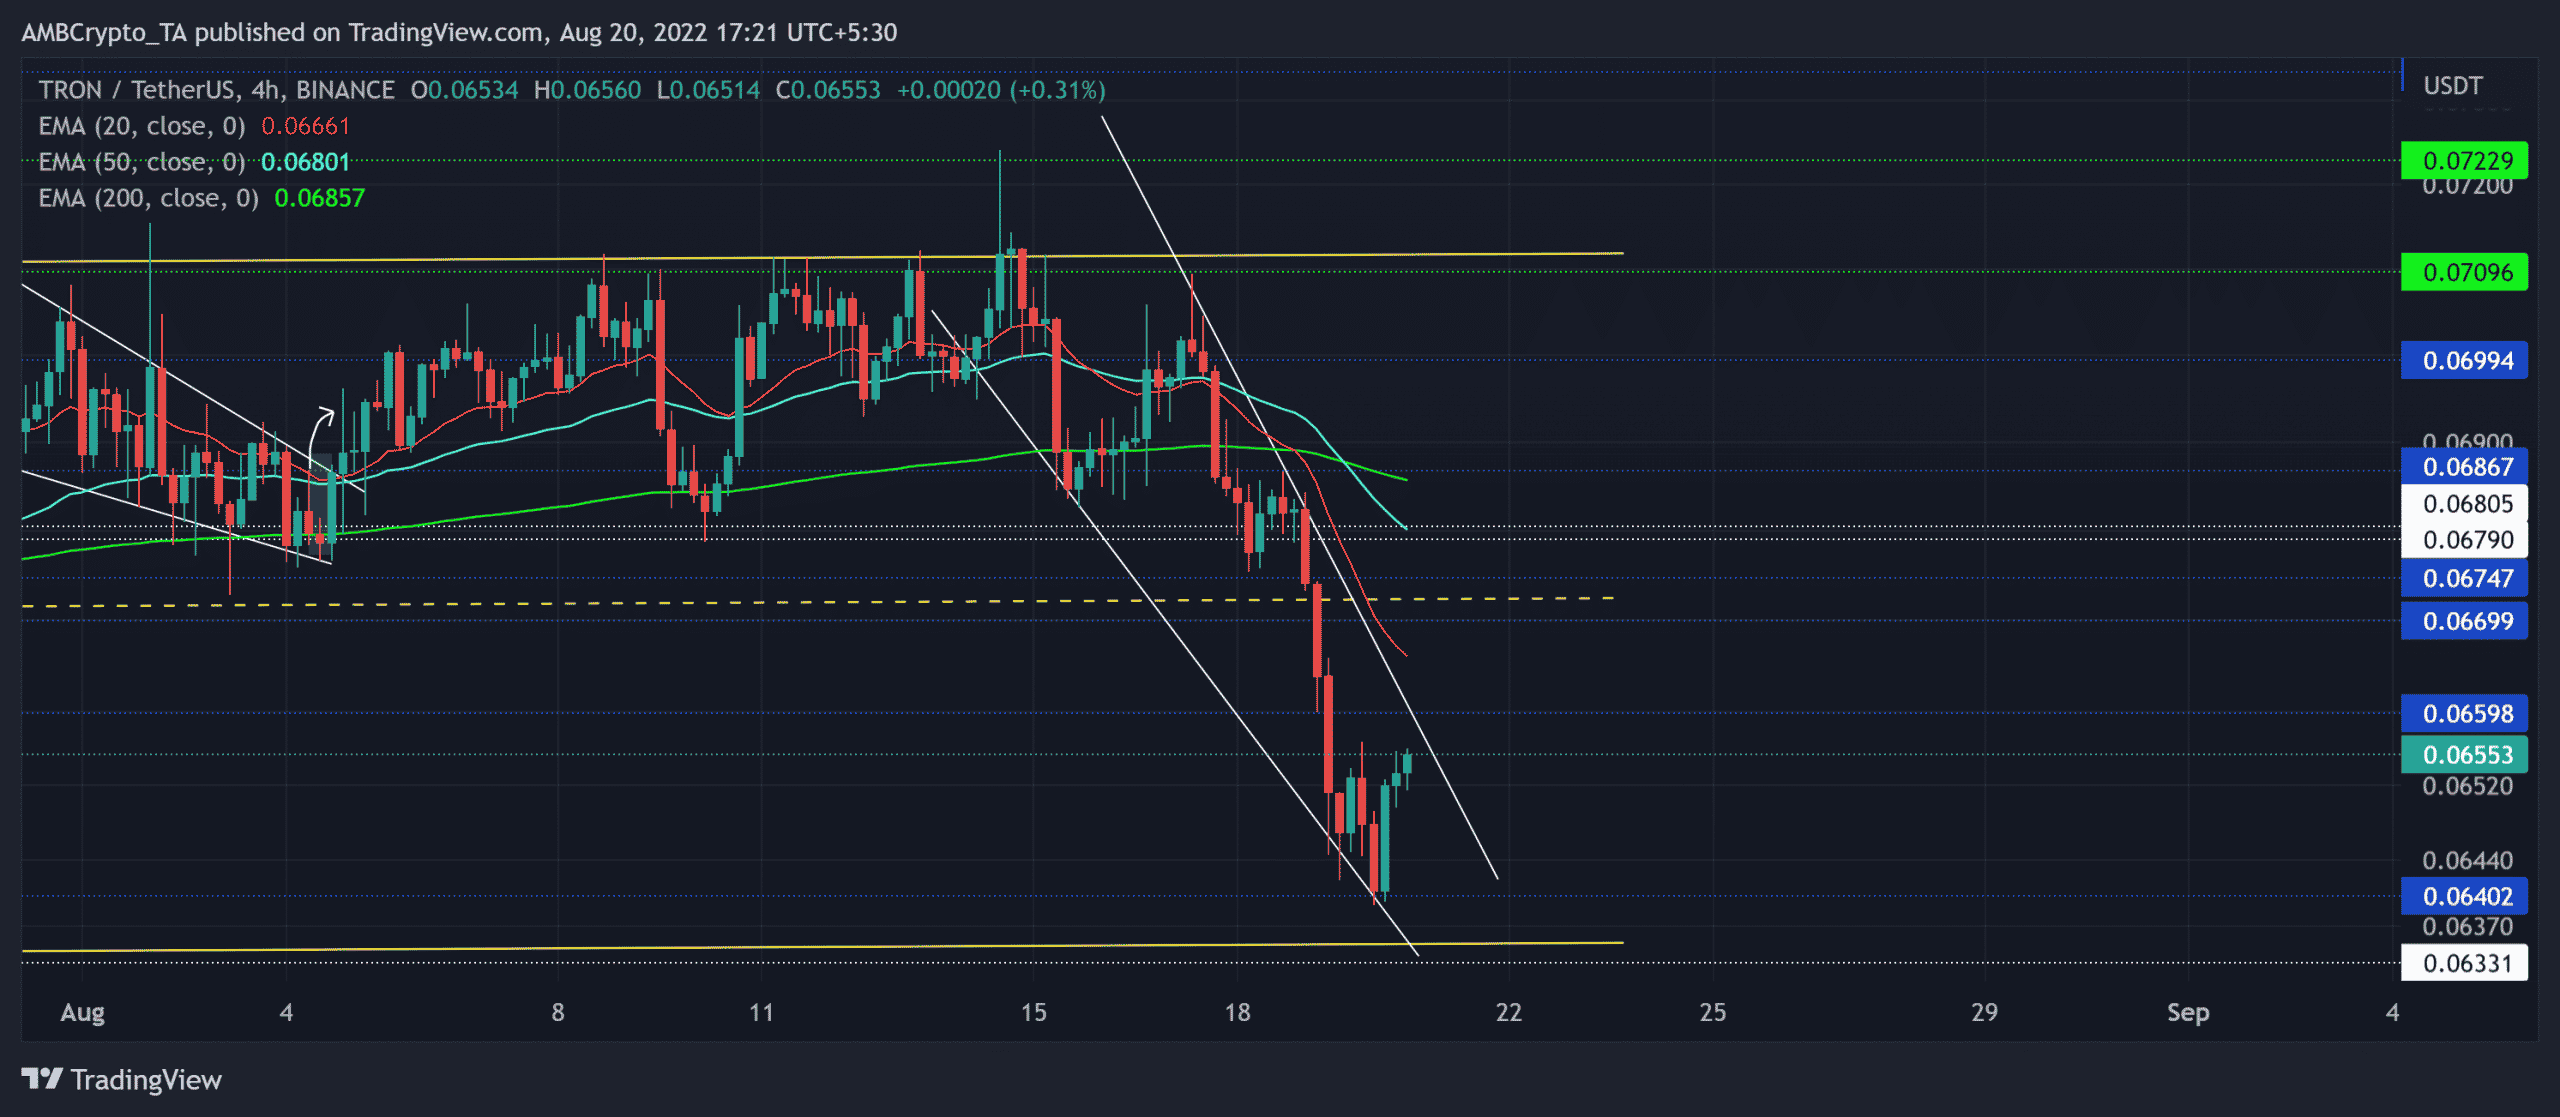
TRX saw an expected reversal after rebounding from the $0.063-baseline. Its previous revival set a solid foundation for retesting the $0.07-ceiling multiple times.
The 200 EMA (green) supported the altcoin’s lows until recently. The bears inflicted a sharp uptick in the selling volumes to provoke a steep decline while chalking out a falling wedge-like structure.
With a 20 EMA (red) and the 50 EMA (cyan) falling below the 200 EMA, the sellers would be keen on maintaining their near-term edge on the chart. The broader trend seemed to skew toward the sellers.
But for nearly two months, the alt has depicted tendencies of bouncing back from its immediate support. Will TRX repeat history?
In such a case, a break above the trendline resistance (white) could propel growth toward the $0.066-$0.067 range. An inability to break the chains of the current pattern could extend the sluggish phase in the coming sessions.
Rationale
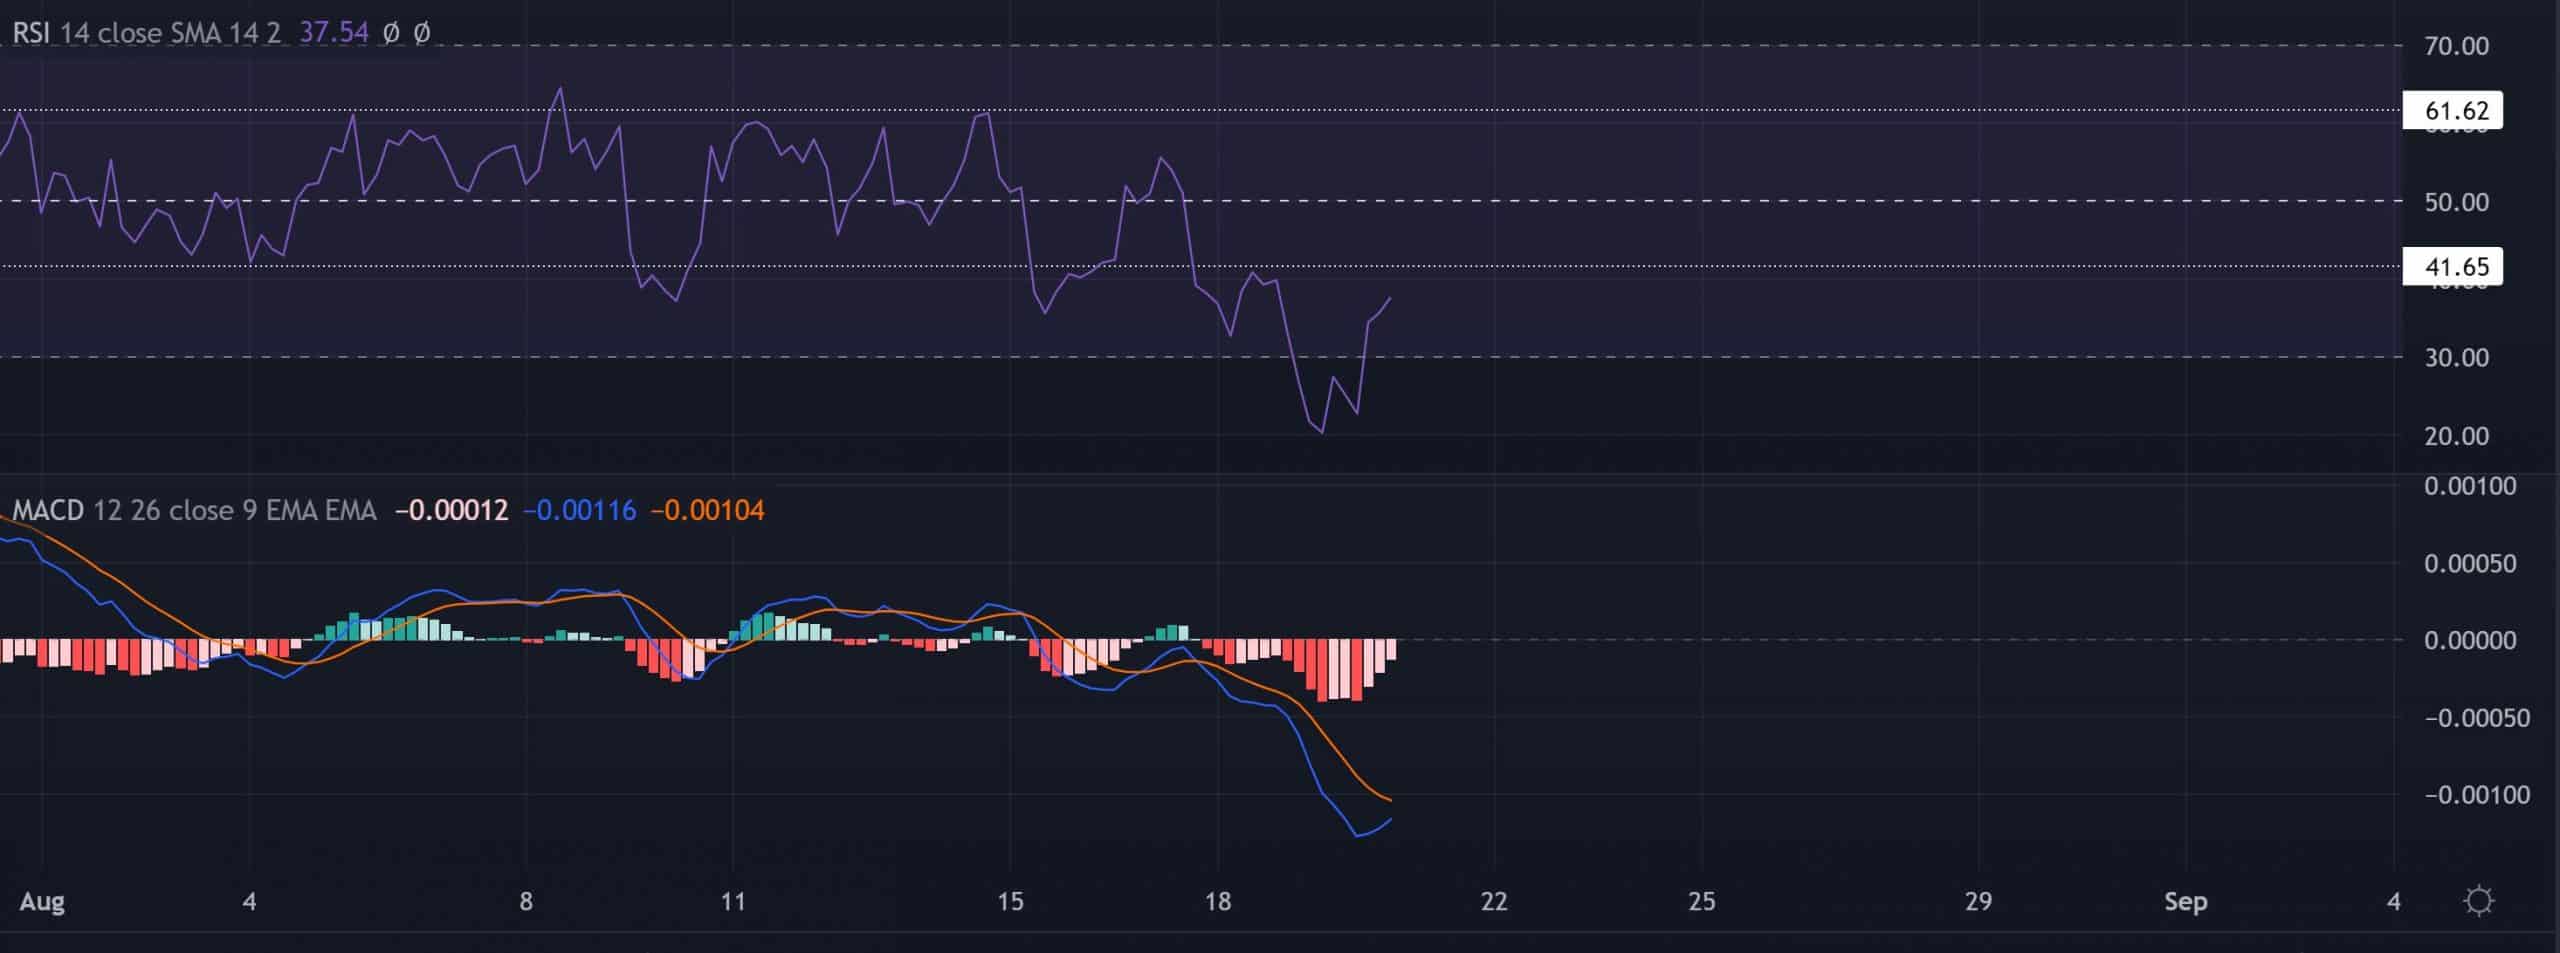
The Relative Strength Index (RSI) jumped above the oversold level while projecting ease in selling pressure. The buyers should look for potential growth above the 41-mark before taking a long position.
Further, the southbound Moving Average Convergence Divergence (MACD) lines touched their two-month low while depicting a strong bearish edge. A bullish crossover of these lines could reaffirm the chances of a gradual increase in buying power.
Conclusion
The past tendencies of the coin to rebound from the immediate support level alongside the oversold readings on the indicators could inflict a reversal. But the death cross on the EMAs would likely constrict the buying efforts. The targets would remain the same as above.
However, investors/traders should consider Bitcoin’s movement and its impact on broader market perception to make a profitable move.