Tron, Huobi Token, Enjin Price Analysis: 16 April

Tron saw a breakout past $0.121 to test the $0.166-level as resistance. Huobi Token also attempted to break a short-term downtrend to push it towards the $22-level but was halted by a wave of selling across the market. Finally, Enjin looked likely to descend below $3 once again.
Tron [TRX]
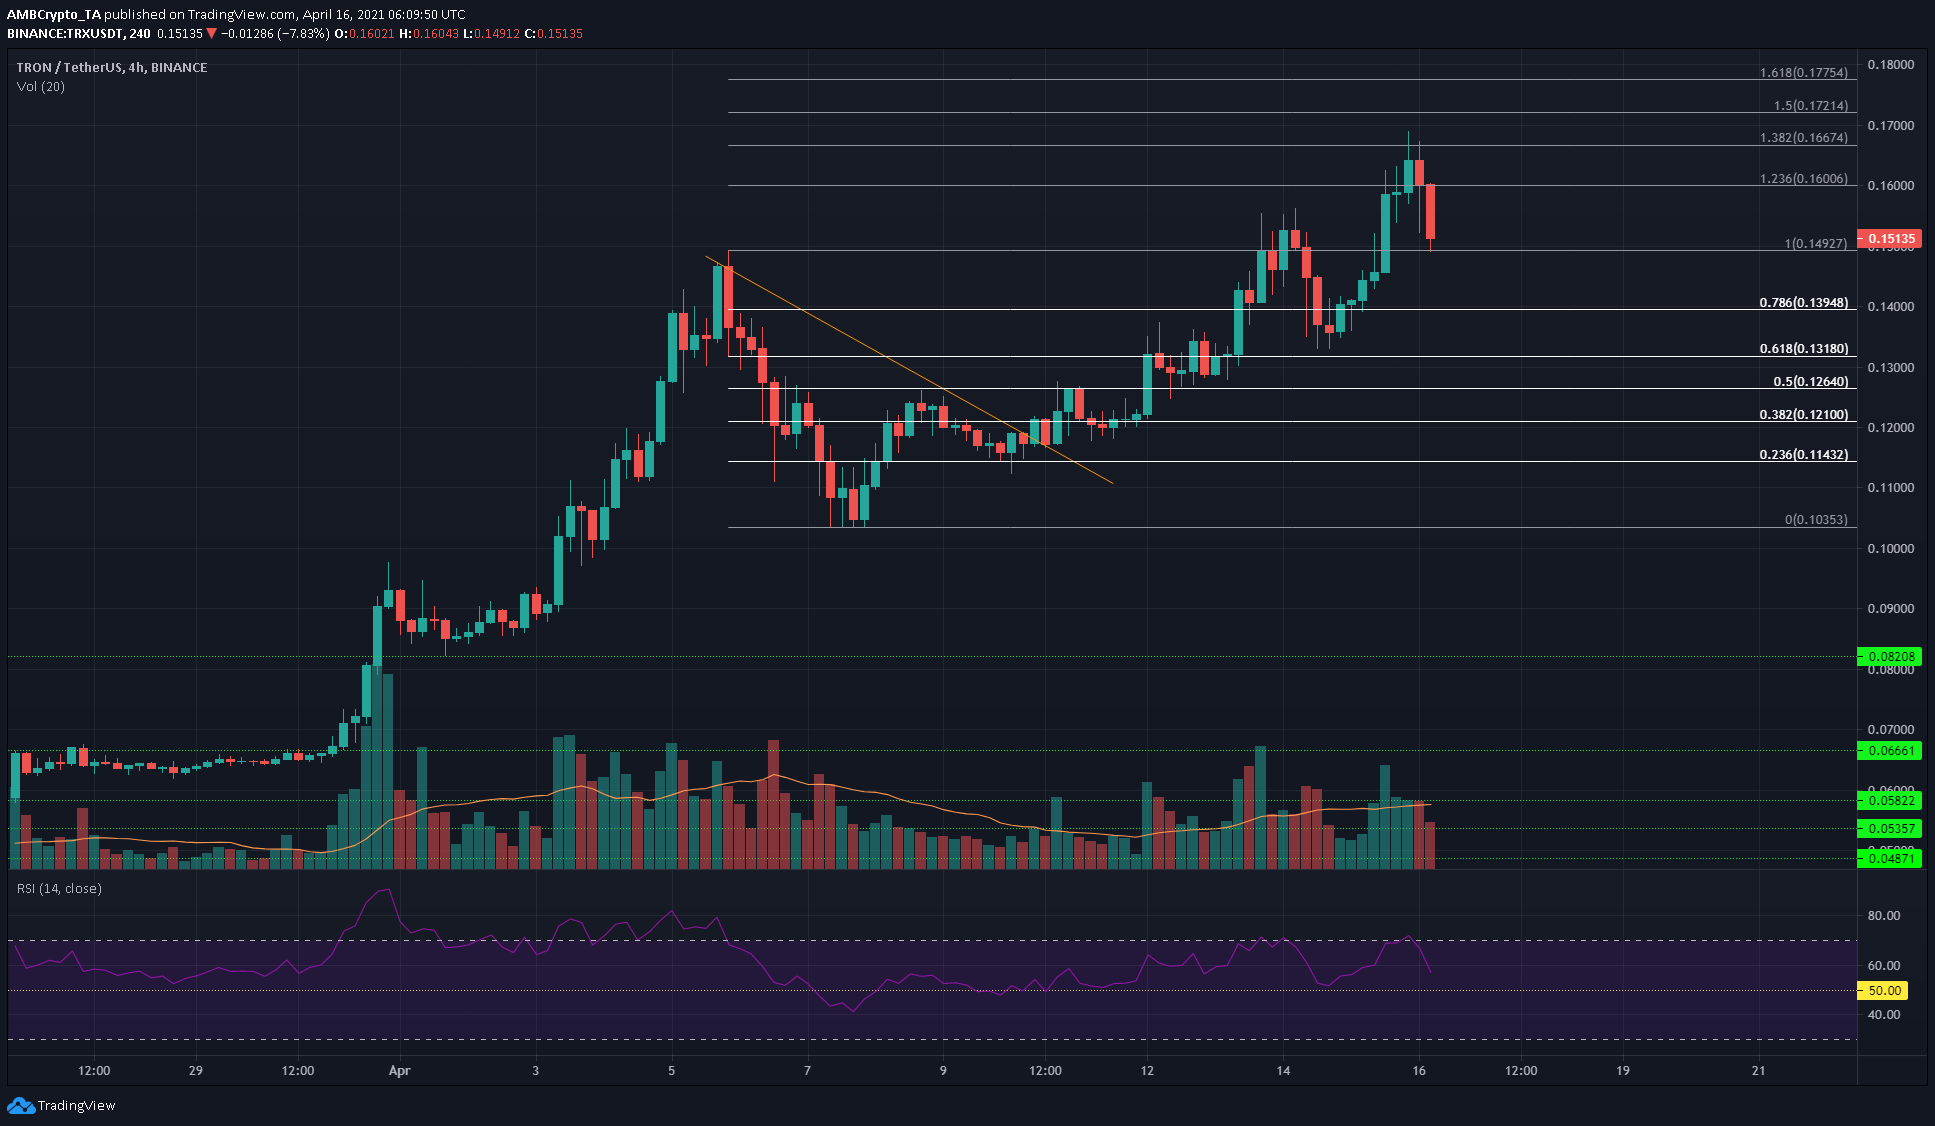
The previous week, TRX faced rejection from the $0.126-level, the 50% retracement level for its drop from $0.149 to $0.103. After this rejection, TRX tested the support at $0.114. Since then, the price has broken out of the descending trendline (orange) to continue its previous uptrend.
The RSI also climbed above 50 when TRX climbed past the $0.121-resistance, and momentum shifted in favor of the bulls then.
The extension levels for this move plotted some overhead resistance levels such as the 138% level at $0.166 and the 150% level at $0.172. Trading volume was strong too and underlined the strong demand in recent days.
Huobi Token [HT]
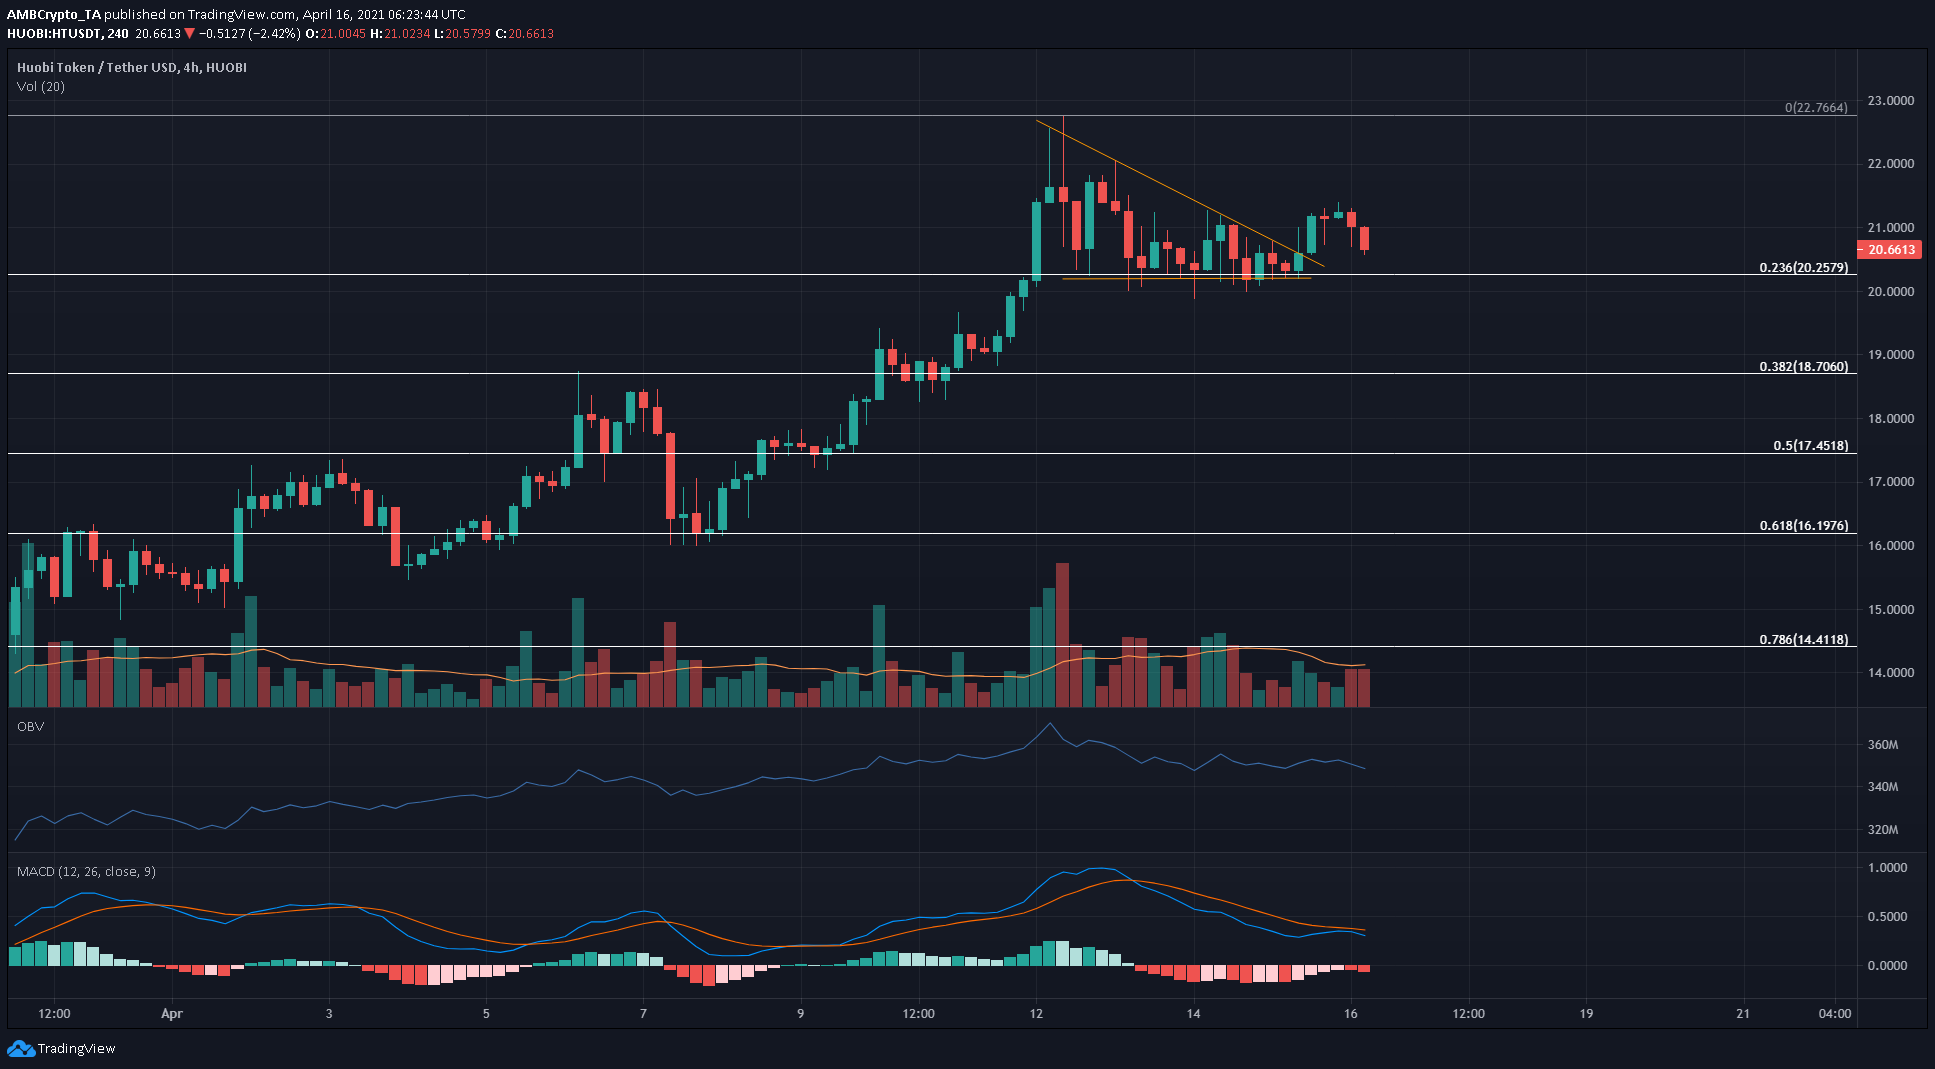
Another exchange token that has been doing extremely well over the past two weeks, HT is likely to have further room to run. It was forced to drop from $21.3 to $20.25 due to the losses in recent hours. This halted a breakout from a descending triangle continuation pattern.
At the time of writing, momentum was bearish in the short-term as the MACD formed a bearish crossover above zero and could take HT back to the $20.2-region. Closing a trading session under this level could see a deeper pullback to find support in the $18.7-$19 region.
The OBV has seen a noticeable pullback as well, despite the uptrend of recent weeks. Buyers were outweighed by sellers over the past few days, and this hinted at bearish sentiment as well.
Enjin [ENJ]
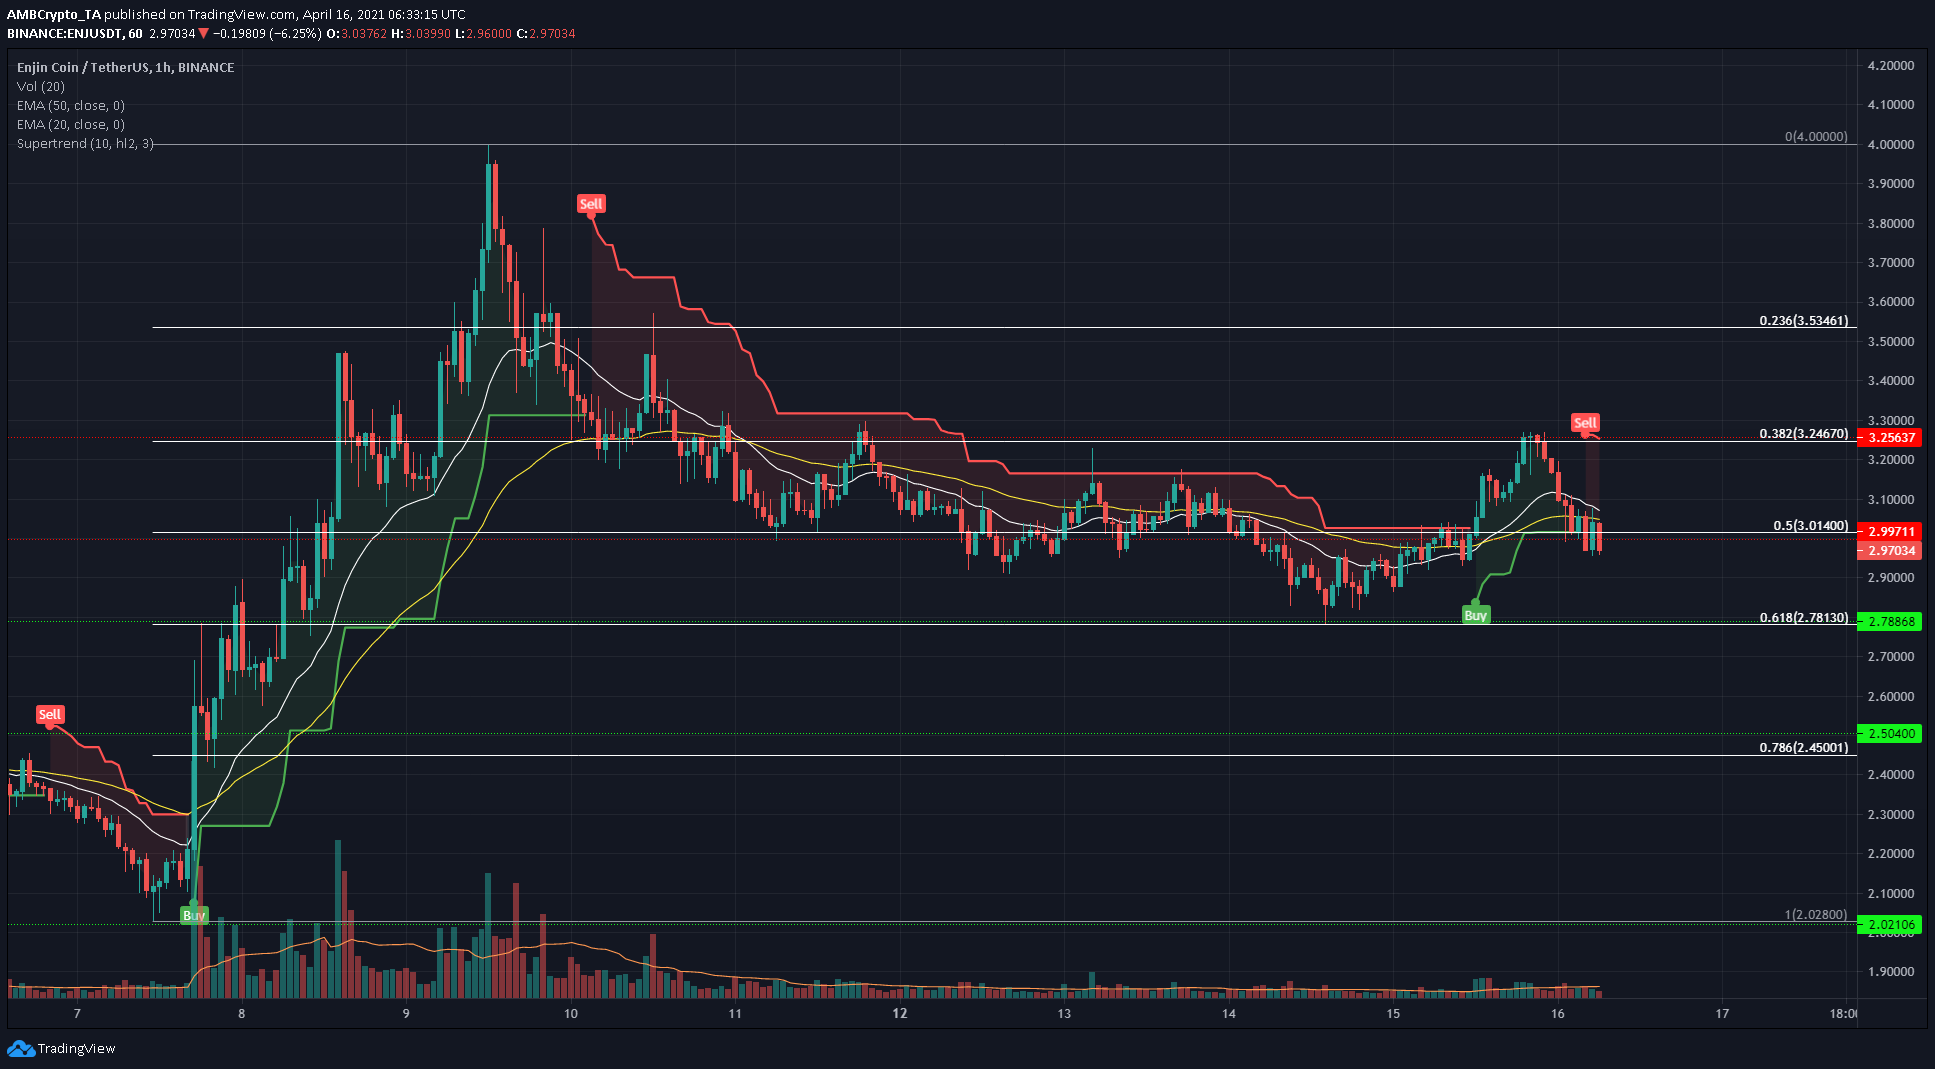
The Fibonacci retracement levels lined up well with some historic levels of support and resistance. Since its surge from $2 to $4, ENJ has been on a strong downtrend that even took it under the 50% level at $3 to test the $2.78-level as support.
Once more, the price appeared to be headed south of $3. The Supertrend indicator gave a sell signal that would only be flipped to buy on a trading session close above $3.24, one which can be used to set a stop-loss with lots of breathing room.
The 20 EMA (white) was above the 50 EMA (yelllow), but falling to highlight the onset of bearish pressure again.