Tron, IOTA, Enjin Price Analysis: 04 January

Bitcoin started 2021 with a bang, with the world’s largest cryptocurrency surging towards the $35,000-mark briefly before corrections pulled it down the price charts. In fact, Ethereum, the world’s largest altcoin, isn’t lagging behind either, with the crypto crossing $1000 for the first time since February 2018.
While the market leaders are looking to make history every single day, the rest of the market is also having a field day on the charts. At the time of writing, Tron, IOTA, and Enjin were all in green territory.
Tron [TRX]

Source: TRX/USD, TradingView
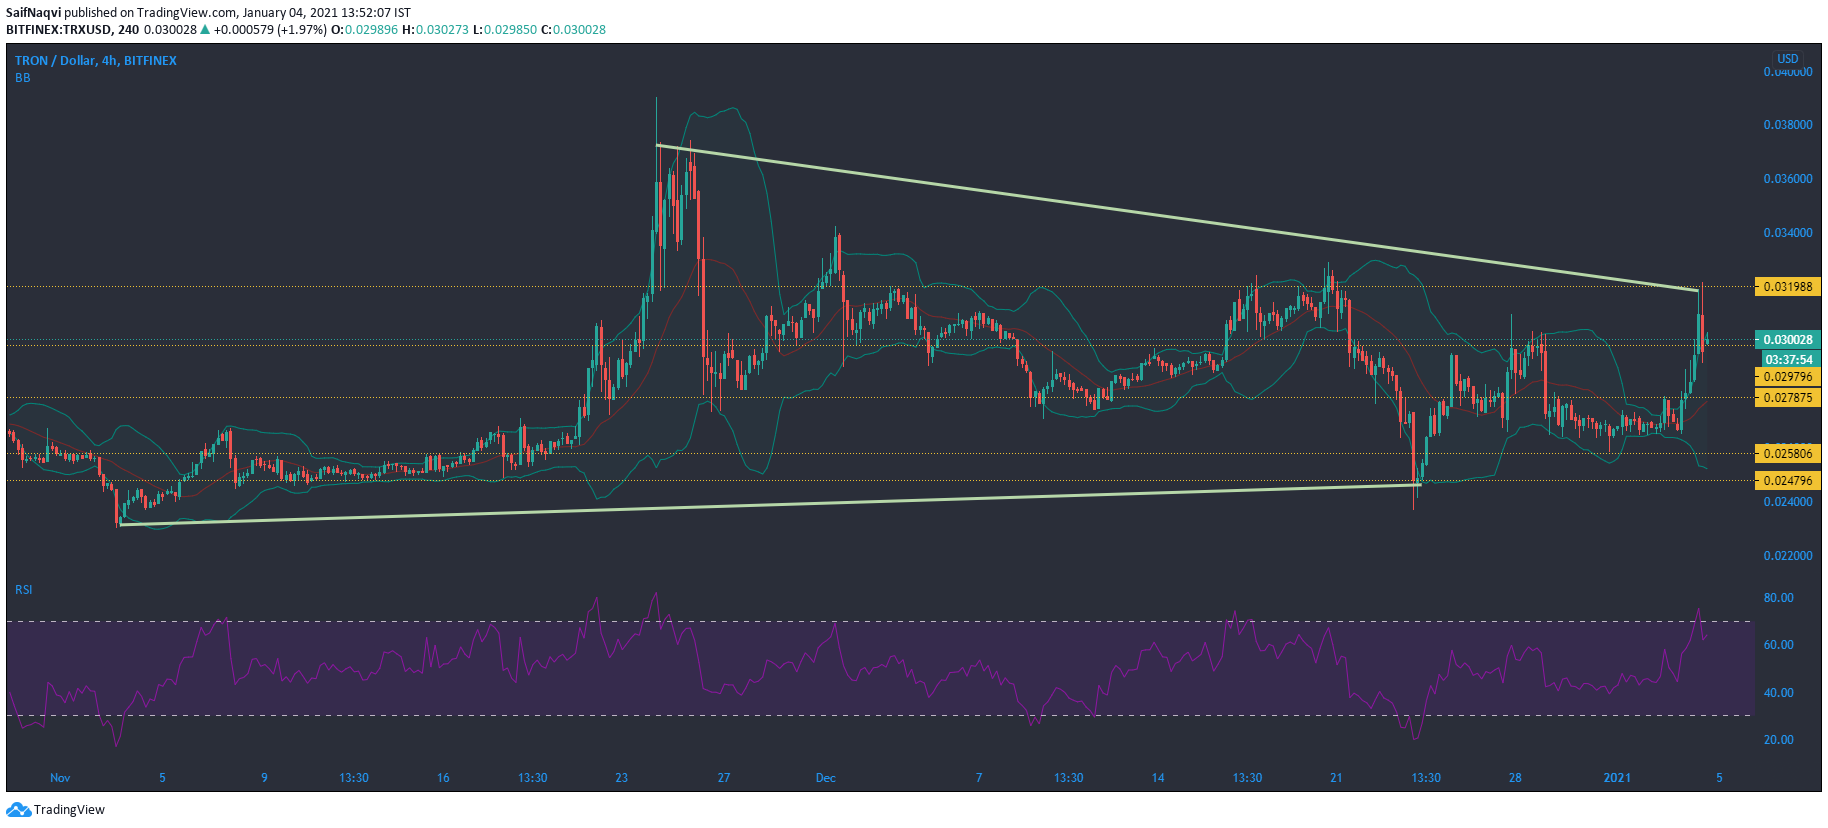
At the start of the year, Tron was trading between a tight channel of $0.027 and $0.025. However, TRX jumped by over 17% soon after and broke above the aforementioned channel as the price headed towards the resistance at $0.031. Undoubtedly, the price surge was backed by Bitcoin’s movement, but how long can Tron hold on to its bullish momentum?
While a hike towards TRX’s end-November levels is certainly a possibility, some indicators suggested that the price could cool off soon.
The Bollinger Bands’ width highlighted a great degree of volatility in TRX’s price. The cryptocurrency’s price also traded on the upper band, indicating that a bearish bounceback could be on the cards if TRX loses momentum.
The Relative Strength Index was falling sharply after trading in the overbought region. A southbound spiral towards the oversold region could see the price fall towards the support at $0.025.
IOTA

Source: IOTA/USD, TradingView
A look at IOTA’s 4-hour chart showed that the cryptocurrency’s price has been in a consolidation phase since November, snapping higher highs and higher lows. While IOTA traded between $0.305 and $0.285 for the past week, a breakout was seen above this channel in the 12 hours before press time as the price hiked by over 8%.
If the price continues upwards, resistance at $0.342 could be tested. On the flip side, if the price loses momentum, it could fall and trade within the previous channel once again. The indicators were inconclusive in providing a definitive answer and suggested that the price could move either way.
The Awesome Oscillator registered an uptick in bullish momentum as the green bars were rising above zero.
The Chaikin Money Flow suggested that capital could be moving away from the crypto-asset, which could be a drag on prices moving forward.
Enjin [ENJ]

Source: ENJ/USD, TradingView
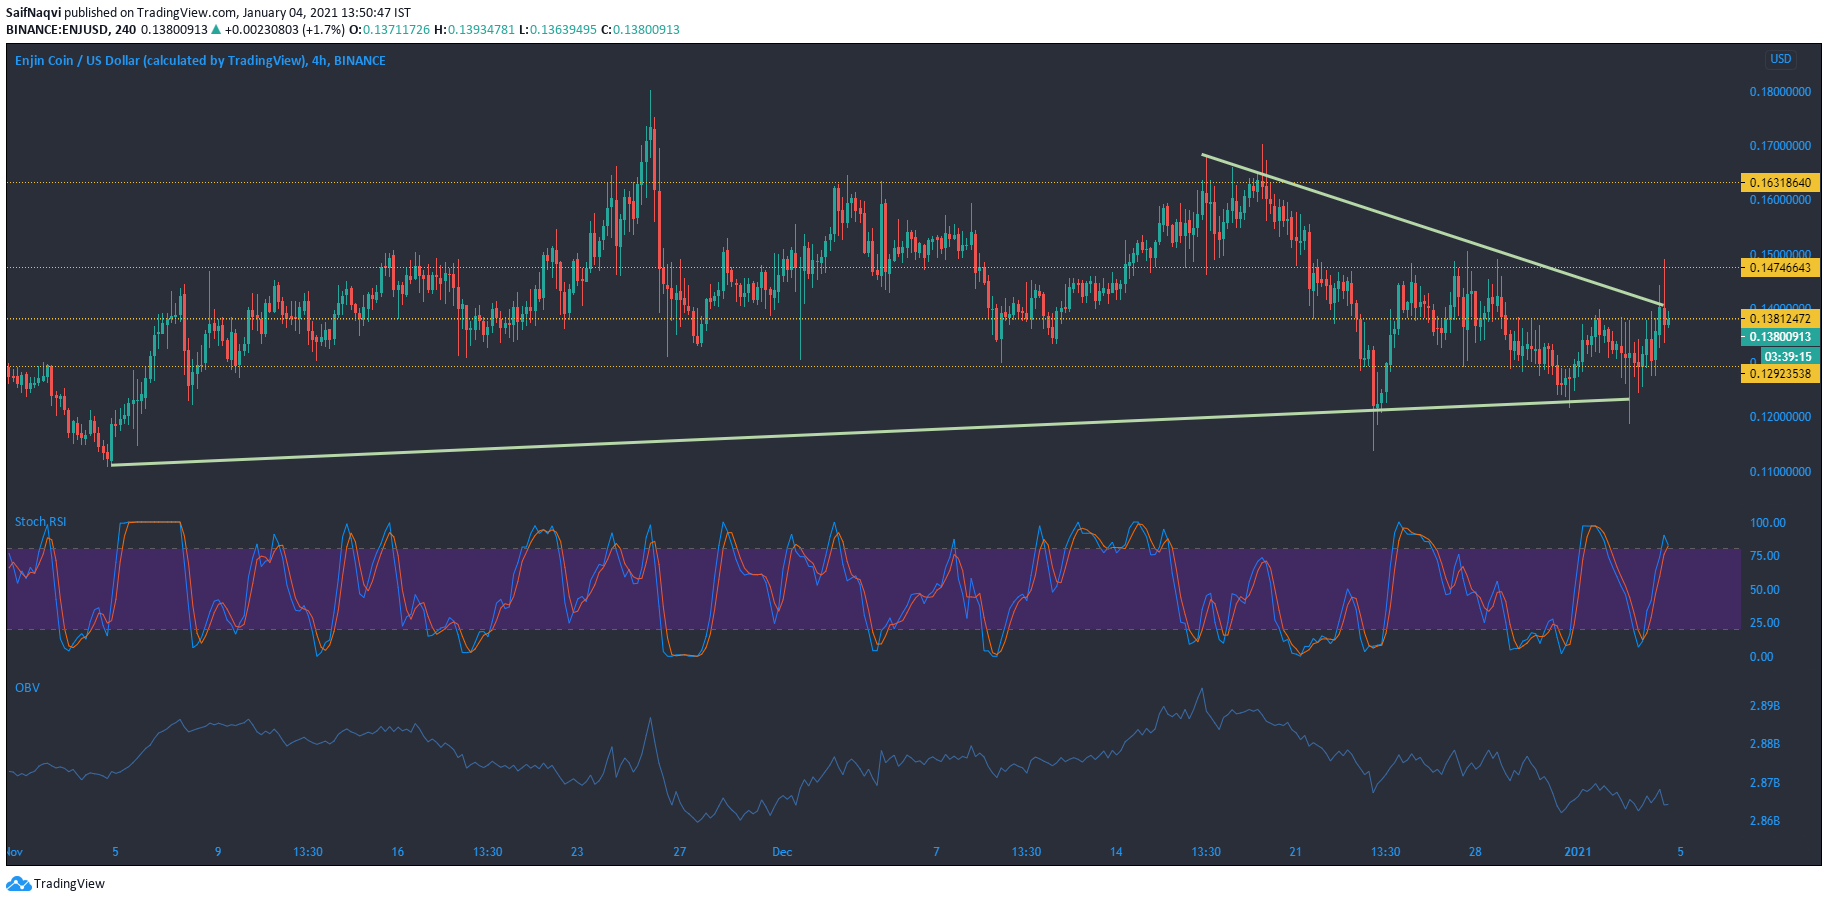
The Enjin Coin, which specifically caters to the video gaming industry, rose along with its counterparts IOTA and Tron. At the time of writing, ENJ was trading at $0.138, up by 6.6% compared to yesterday. While the latest spike in prices helped ENJ rise above the trading channel of $0.138 and $0.129, some indicators suggested that the prices could fall in the short-term.
The Stochastic RSI was moving south from the overbought region, while a bearish crossover was on the horizon. Both these factors proposed that the price could indeed move lower on the charts.
The On Balance Volume demonstrated that interest in the crypto-asset was on a decline, as the index moved towards its early-December lows.


