Tron, IOTA, Nano Price Analysis: 06 March

Tron climbed back above the $0.05-level and the bulls were able to defend this level from selling pressure, an early indication that TRX was on the path to recovery back towards its local highs. IOTA formed a bullish pattern and broke out, but fell short of achieving its technical target. Finally, Nano formed a bearish pennant pattern on the charts.
Tron [TRX]
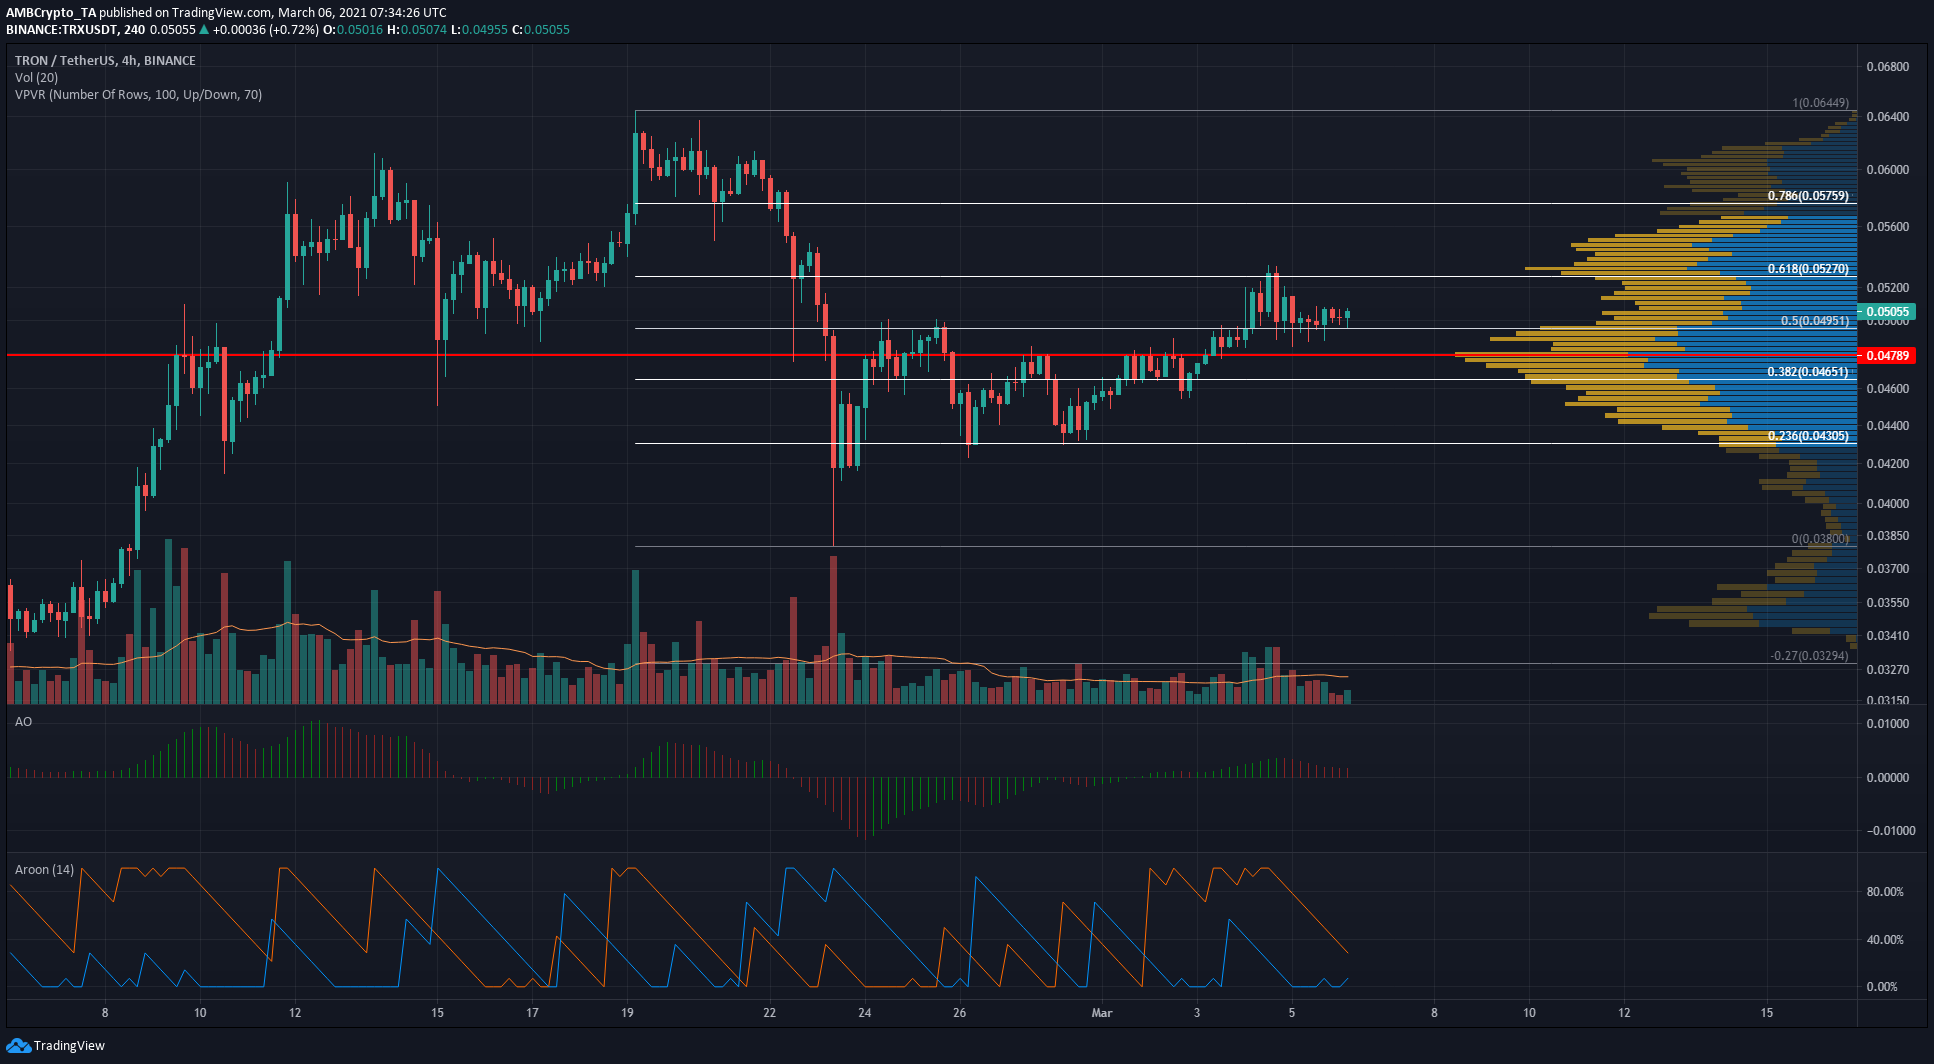
According to the Volume Profile Visible Range, the Point of Control was at $0.047, a level TRX was trading above at the time of writing. The Fibonacci retracement levels for TRX’s plunge from $0.064 to $0.038 highlighted some levels of importance, the most important being the 50% level at $0.049.
The past few days have seen TRX bulls defend this level as the price consolidated in the $0.0495-$0.05 region. The Aroon indicator showed that bulls were in control over the past few days as they drove the price higher from the $0.043-level of support. The Awesome Oscillator continued to stay above zero.
IOTA
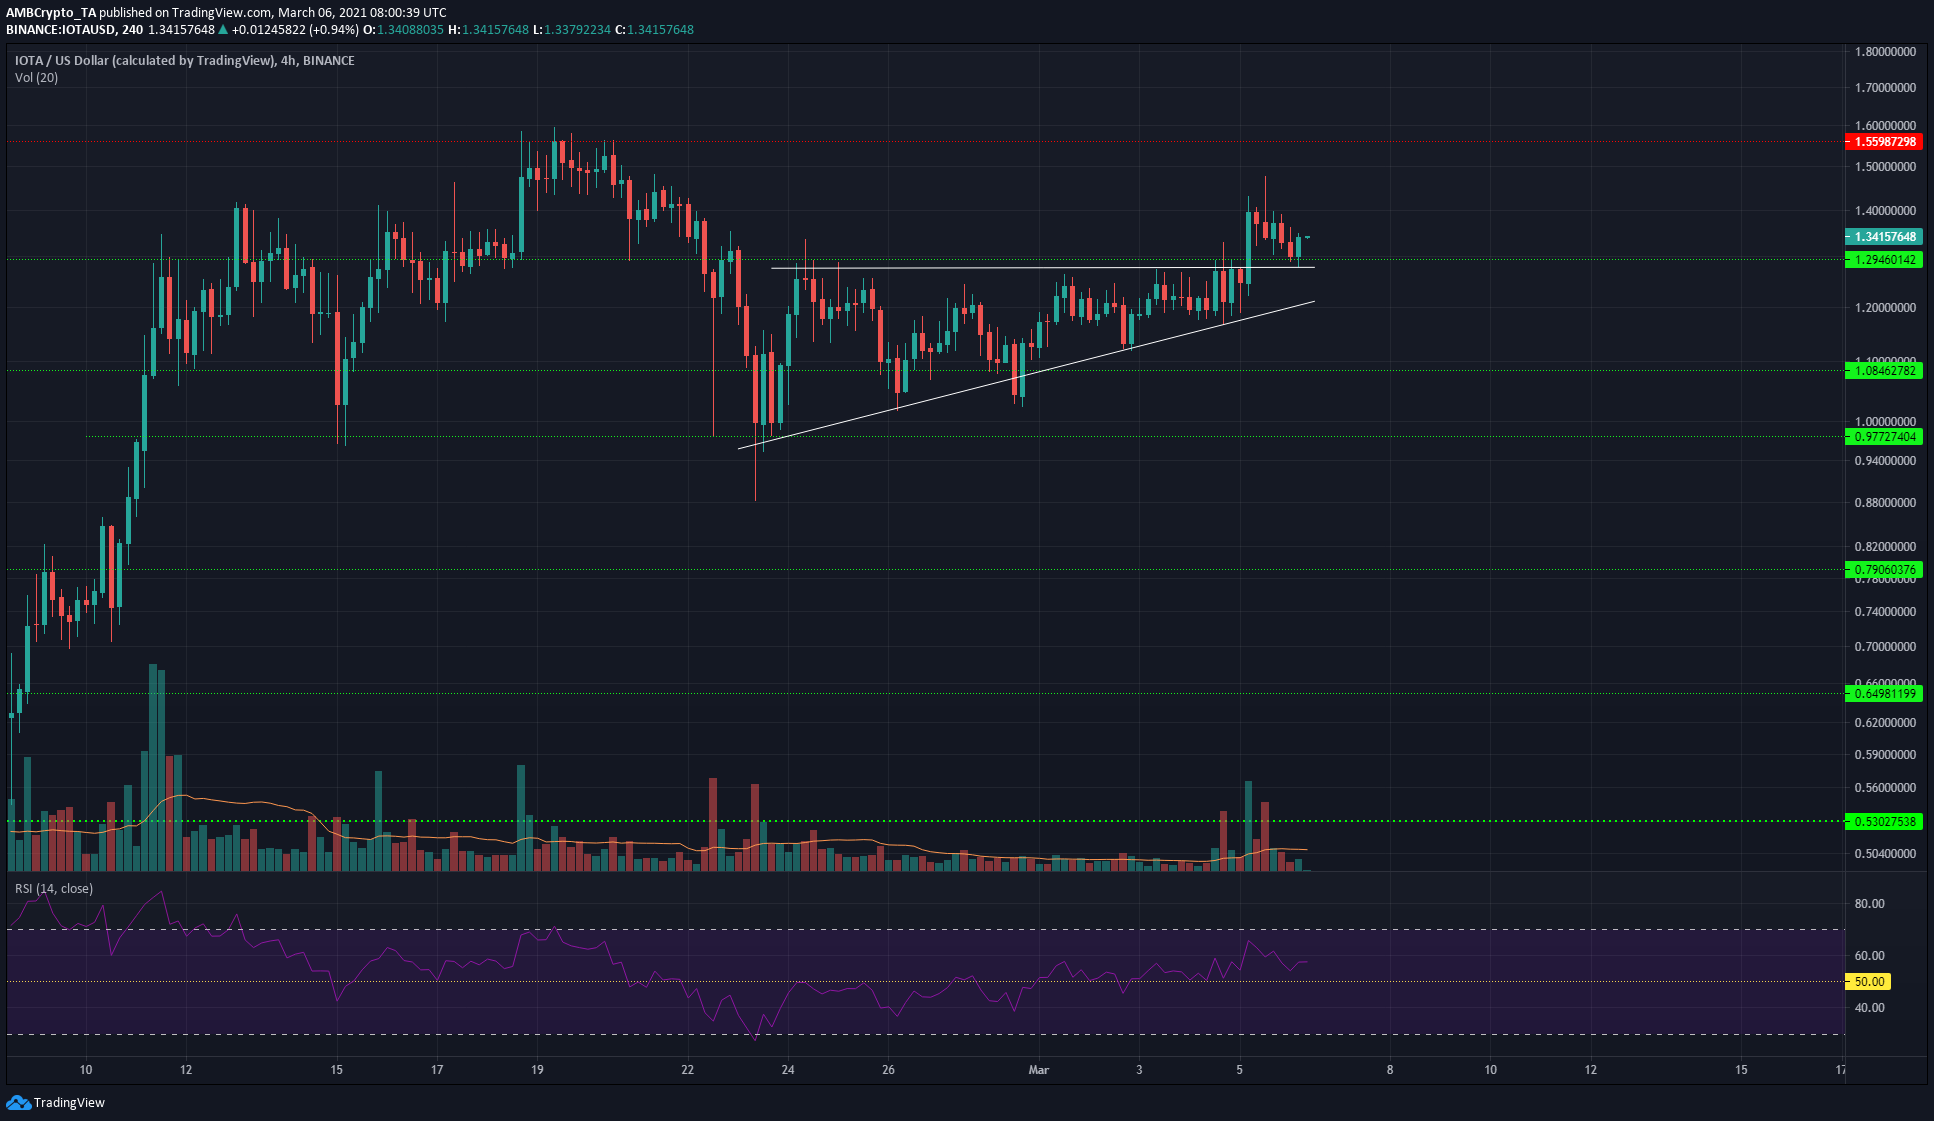
The ascending triangle pattern projected a target of $1.56 for IOTA to achieve following its strong breakout past the $1.277-mark. It touched the $1.48-level, but that trading session saw bulls exhausted and bears continued to force the price lower to test the $1.27-level once more.
The RSI continued to move above zero to show that an uptrend was in progress. A retest of the former area of resistance is not a bearish development, and bulls would be looking to push the price past $1.48 once more.
Nano [NANO]
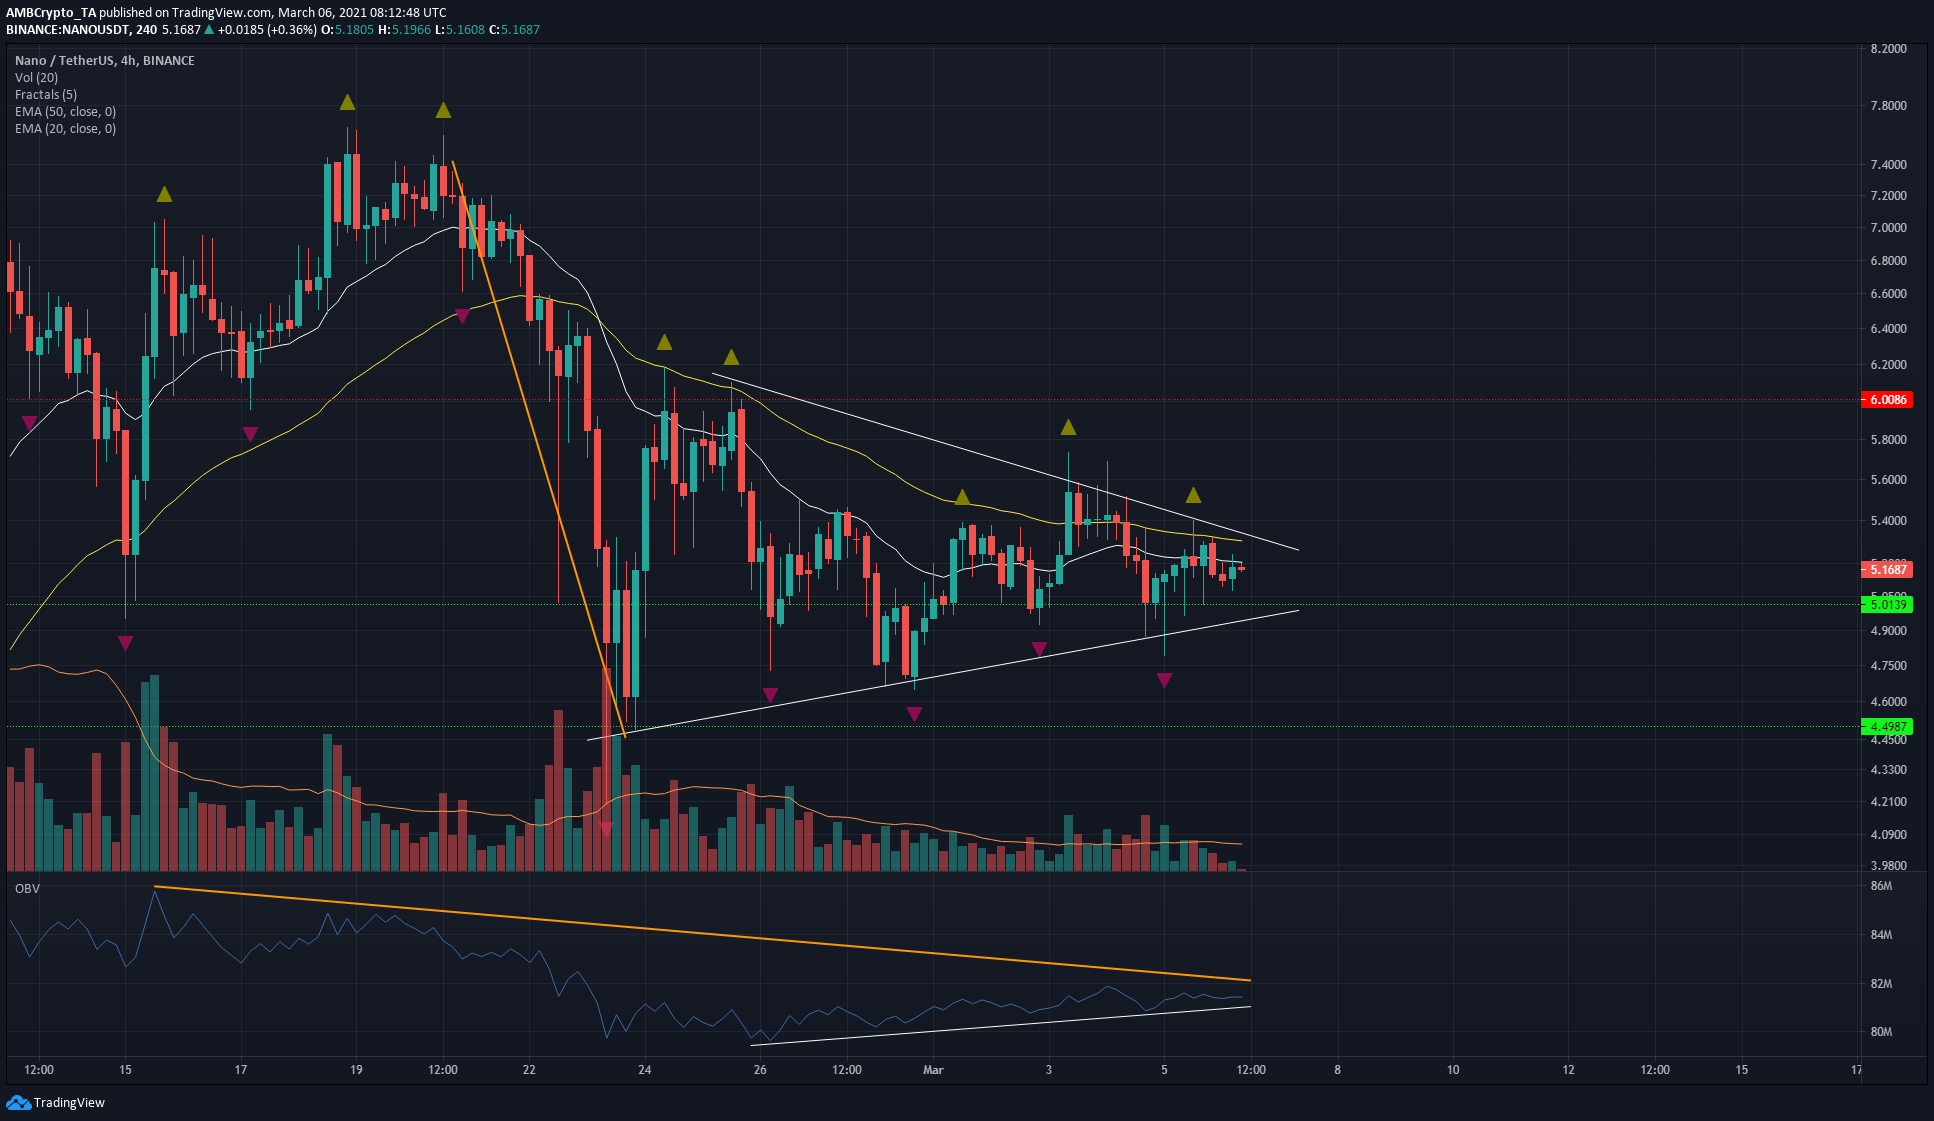
NANO formed a bearish pennant pattern on the charts, a continuation pattern that generally sees the price drop under the flag. The fractals registered significant touches on the pennant’s trendlines. The 20 and 50-period EMAs (white and yellow respectively) showed that momentum was on the bears’ side.
The OBV highlighted that the past few weeks saw seller dominance, yet there was some fightback from the buyers recently. This skirmish between buyers and sellers could soon have a winner.
Losing the $4.9-$5 area of support over the next few days will see NANO drop further on the charts.