Tron, Ontology, Uniswap Price Analysis: 22 January

Tron rose towards its previous level of support to test it as resistance and confirm its flip to resistance as bearish pressure mounted on the charts. Ontology also showed that it was on the verge of losing an important level of support to the bears. Finally, Uniswap bounced off a level of support.
Tron [TRX]

Source: TRX/USDT on TradingView
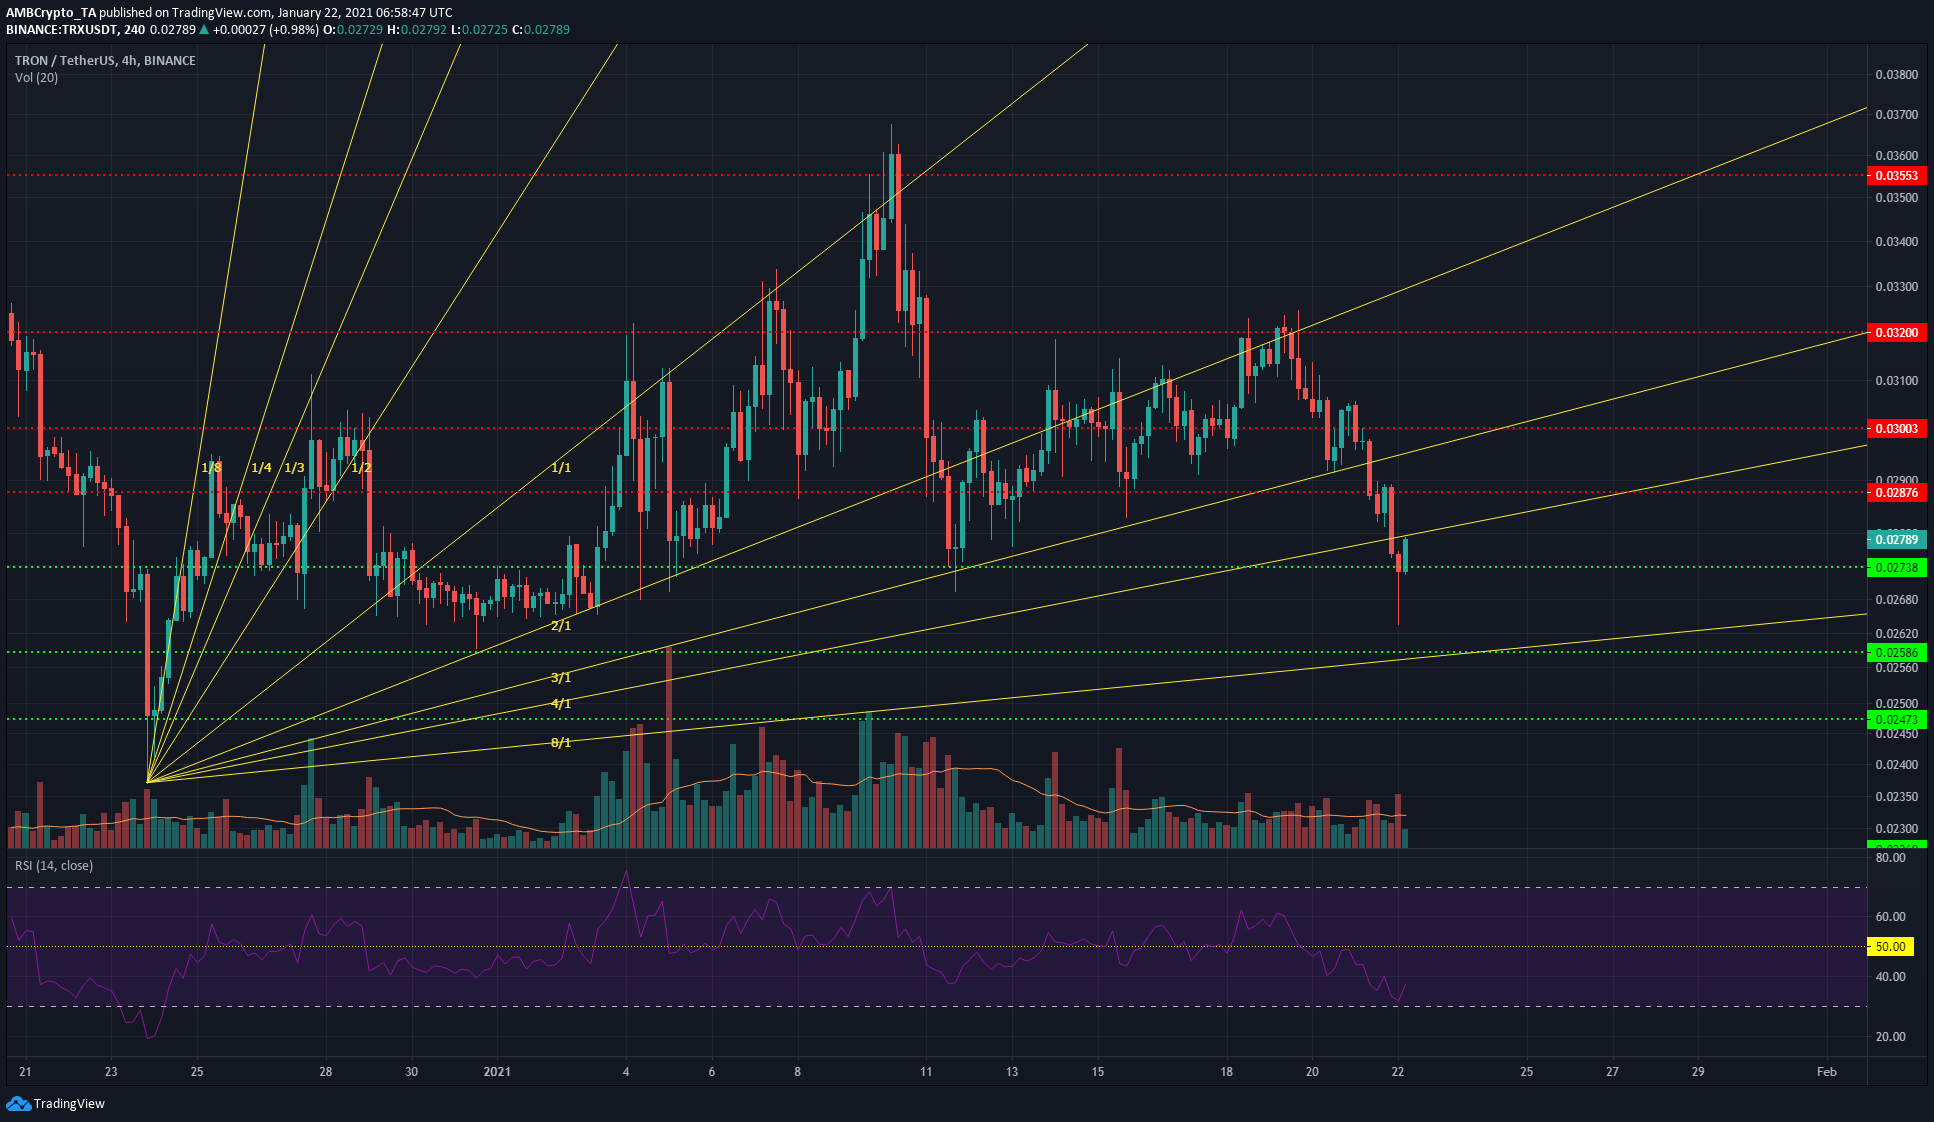
The Gann fan lines from the $0.02371-low in late December highlighted some areas of potential support and resistance. Recent weeks have seen these lines respected by the price, and at the time of writing, the 4:1 line could present resistance to TRX.
The RSI noted strong bearish momentum following the selling pressure in recent days. There wasn’t a sign of a reversal yet, and even if TRX manages to climb past the 4:1 line, it will find a horizontal level of resistance at $0.0287.
In the coming days, rejection from the $0.028-region will see TRX lose the $0.0273-support level.
Ontology [ONT]

Source: ONT/USDT on TradingView
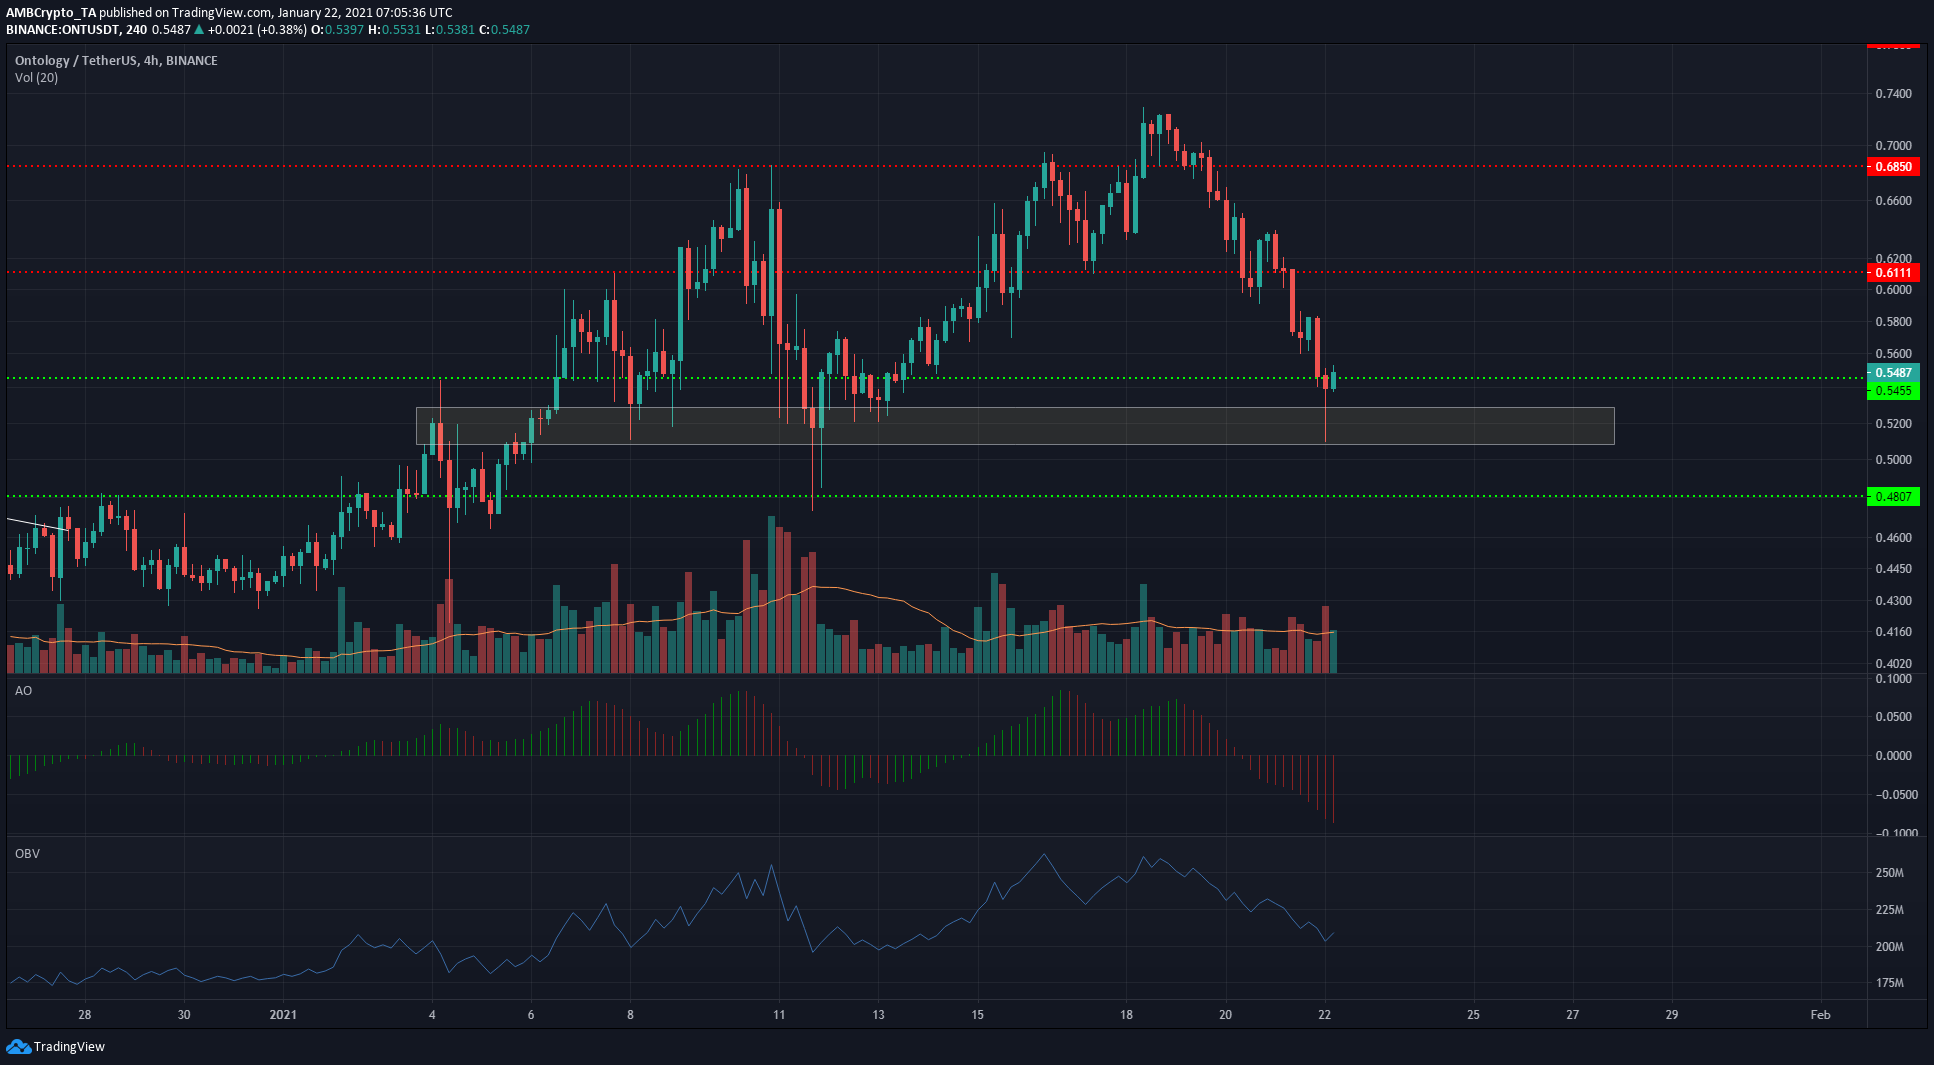
The Awesome Oscillator, unsurprisingly, showed strong bearish momentum behind ONT as it dropped under the zero line. According to the OBV, selling volume was also increasing over the past week as ONT lost multiple levels of support after reaching a local high at $0.72.
The $0.54-level is of notable significance – Recent months have seen the price move strongly once this level was captured by either the bulls or the bears. Hence, ceding this level to the bears will see the $0.50-$0.52 highlighted region subject to selling pressure. Losing this region will likely see ONT drop to $0.48 and possibly, as far south as $0.44-$0.45 region.
Uniswap [UNI]

Source: UNI/USDT on TradingView
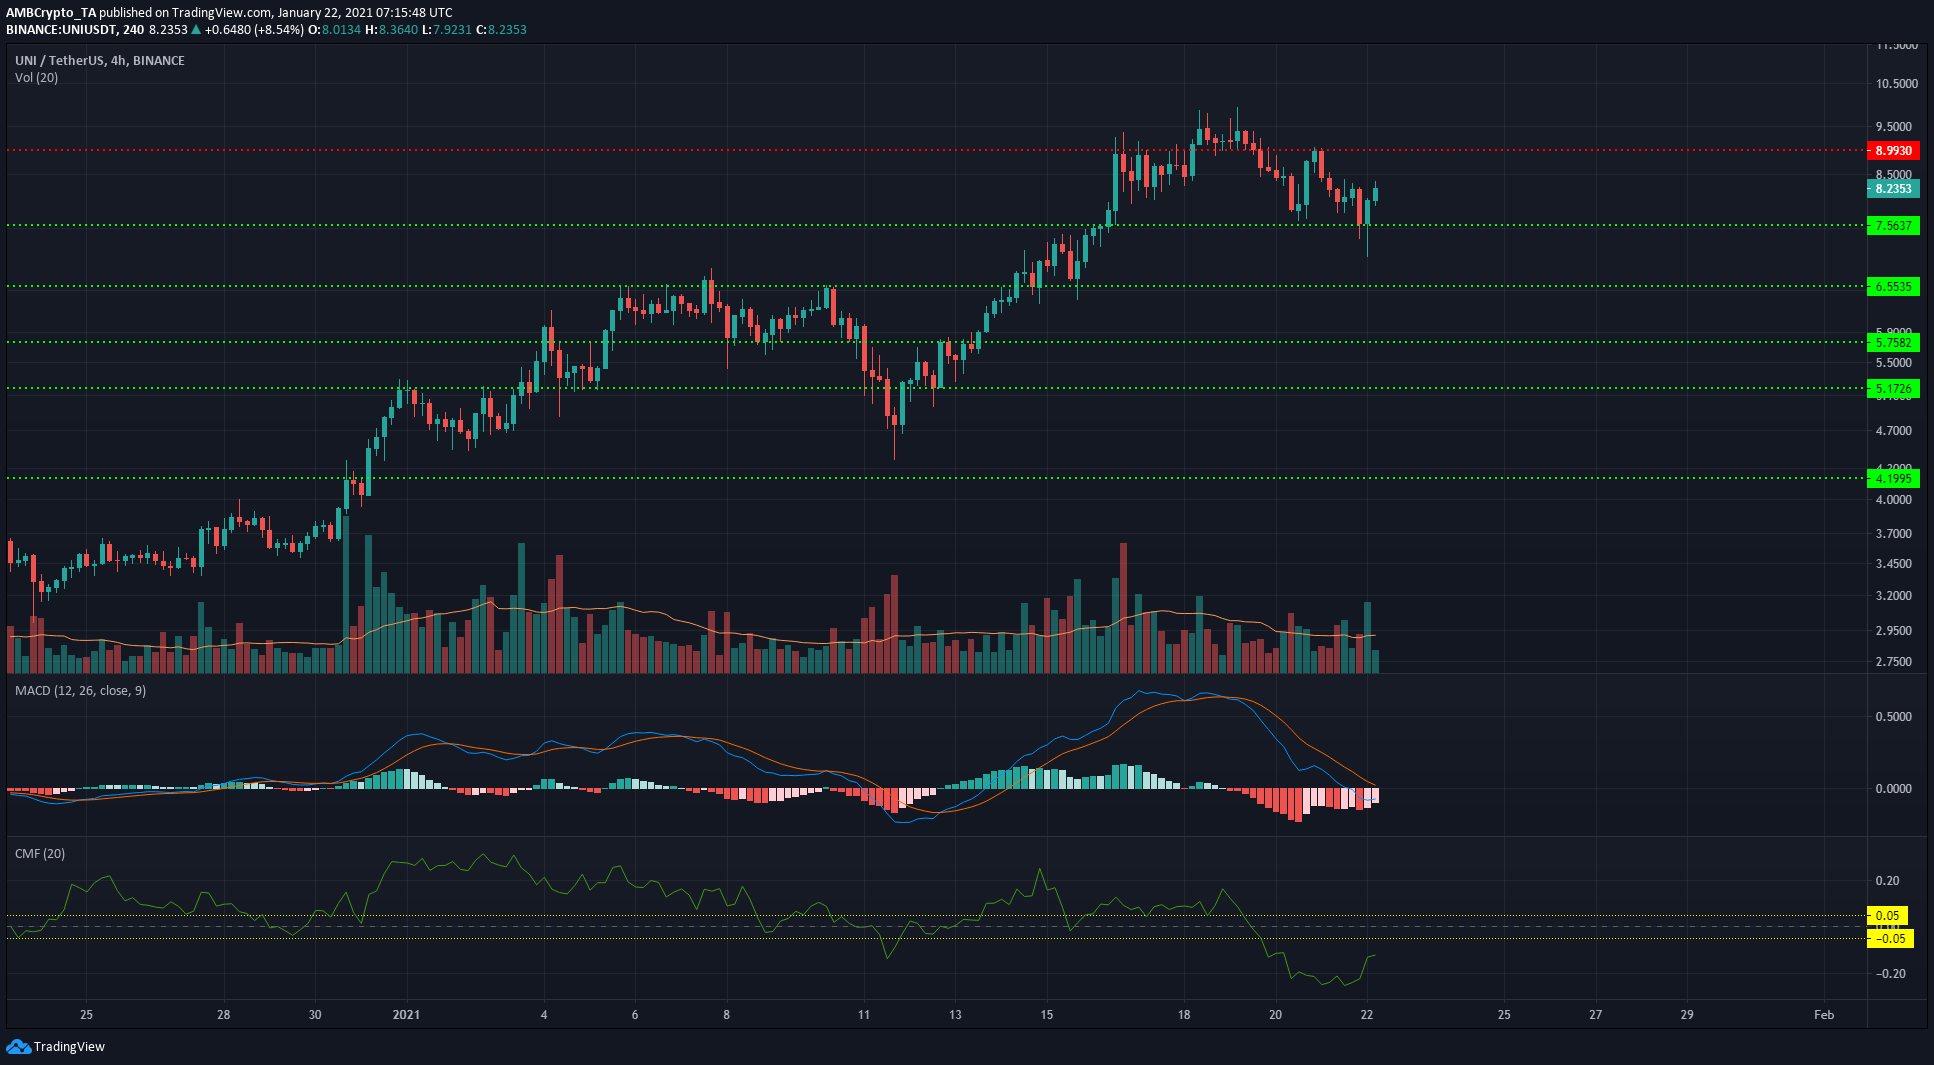
The MACD suggested that southbound momentum was prevalent and was just above the neutral line, but the price found some footing at the $7.56-level of support. Following the same, UNI was driven up to $8.22 on the charts.
The Chaikin Money Flow showed that capital flows out of the market exceeded inflows, denoting selling pressure.
If UNI manages to climb above $9, entering a long trade can be considered. A drop below the $7.56-level would indicate a move towards $6.55. The lower timeframes showed that momentum was oscillating in the bulls’ favor. Rising above $8.45 would give bulls some hope over the next few hours.


