Tron, Waves, Dash Price Analysis: 26 February

Tron tested the $0.043-level of support and Waves was forced lower as well due to a strong wave of bearish sentiment following Bitcoin’s drop under $50,000 over the last twelve hours. Finally, Dash’s market bulls sought to defend the psychological $200-level of support.
Tron [TRX]
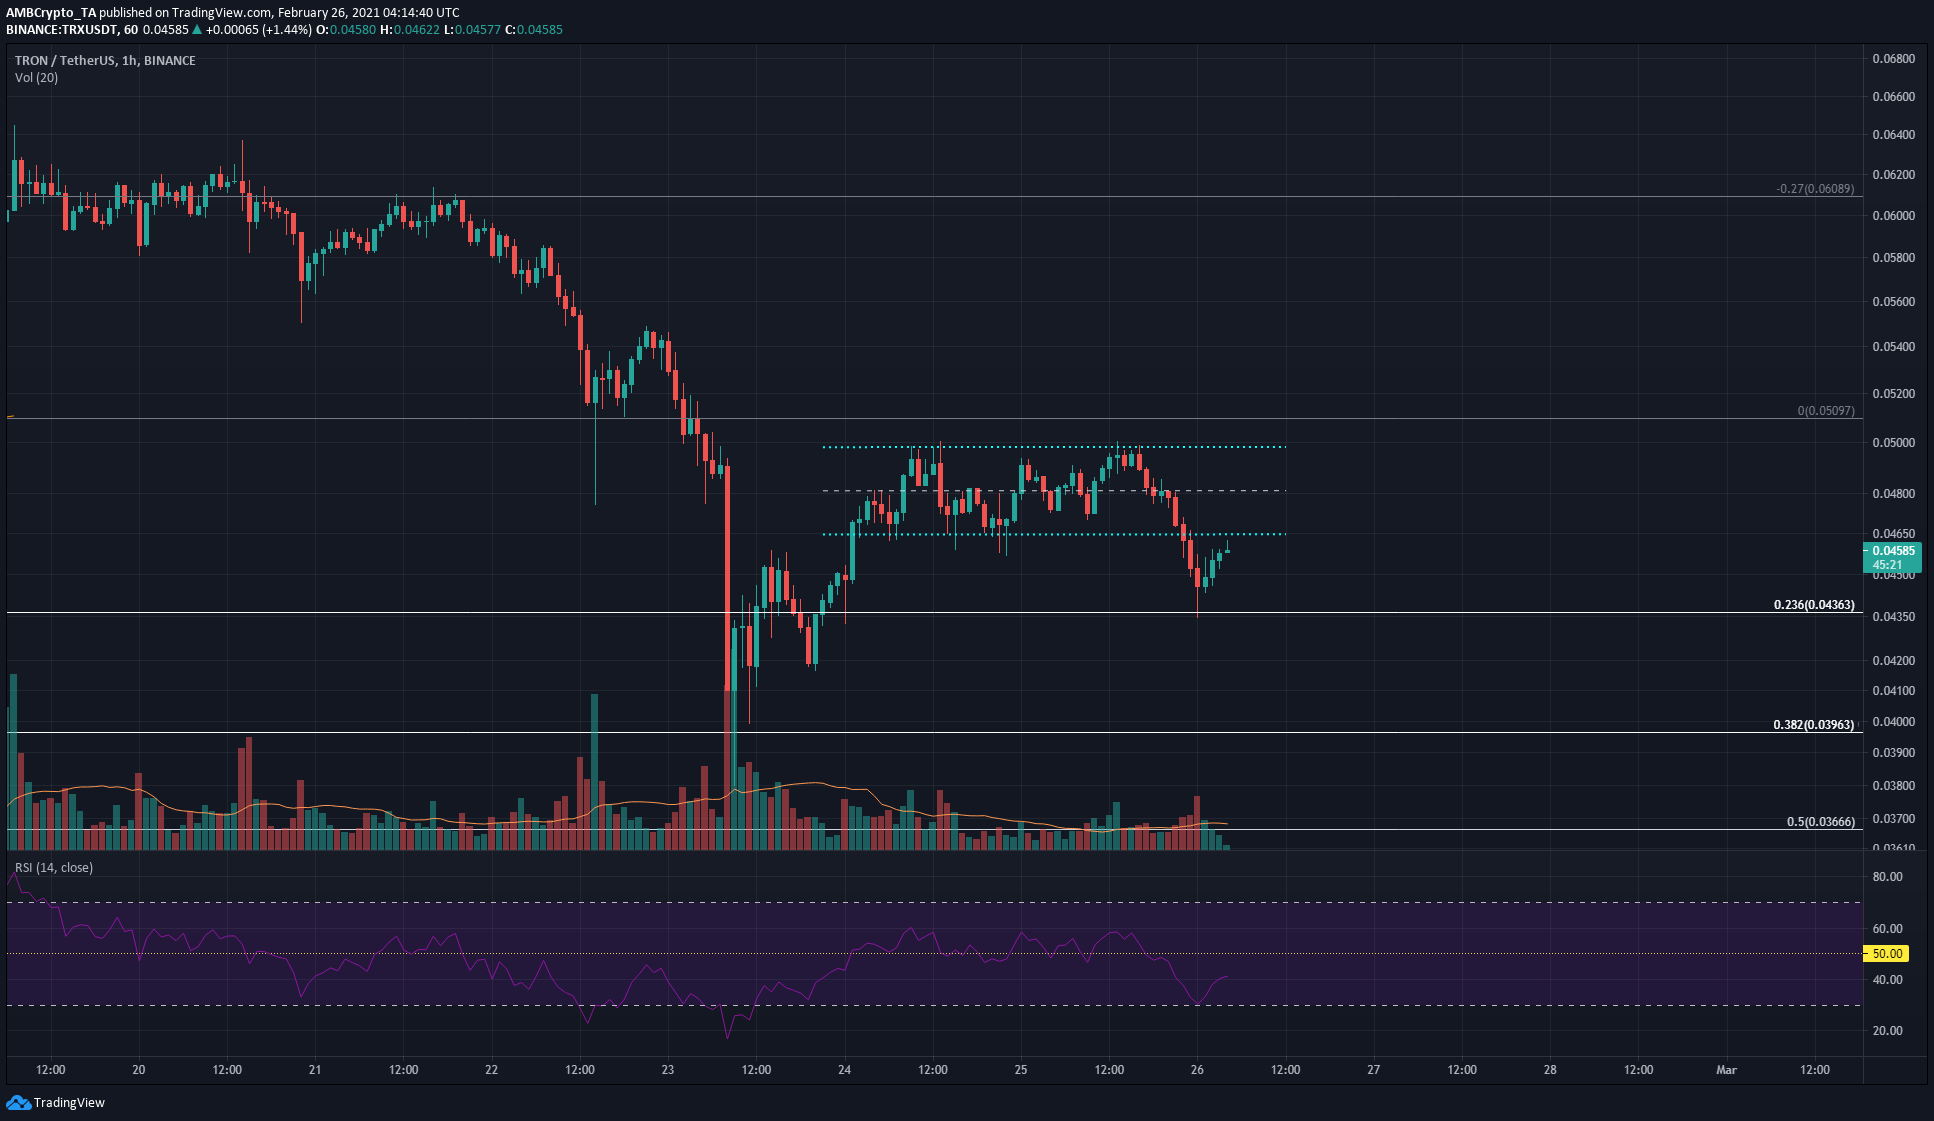
TRX formed a range on the hourly chart over the past couple of days. The highs were at $0.049 and the lows were at $0.046. Since this timeframe is quite short, the importance of the range can be dismissed.
However, over the next few hours, TRX looked likely to retest the previous range lows as resistance and move towards $0.043 once again. The RSI sank below 50 to highlight bearish momentum. Finally, the trading volume also picked up when the price fell, affirming the move as one driven by market sentiment.
Waves [WAVES]
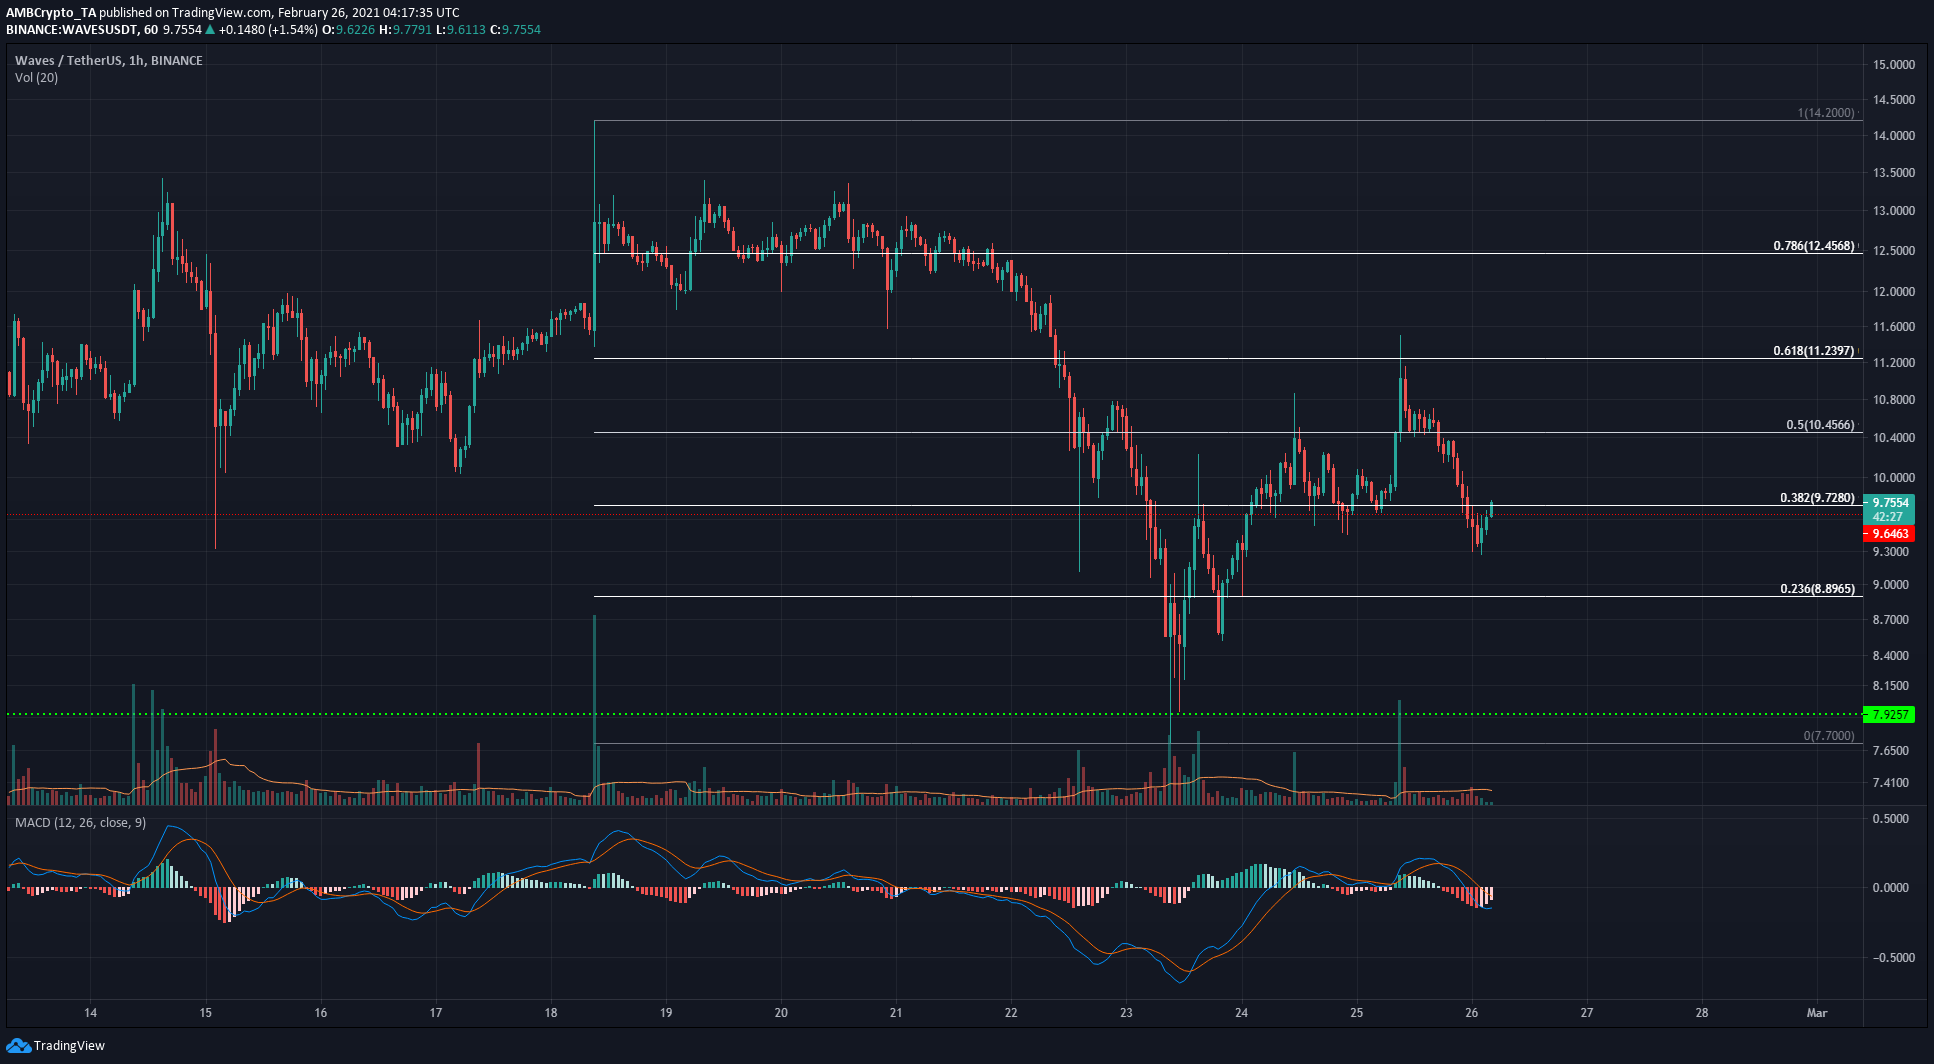
Using the Fibonacci retracement levels, some levels were highlighted as potential supports for WAVES. Over the past few hours, the crypto’s price fell with strong momentum under the $10.45-level, with the crypto trading at $9.75, at the time of writing.
The $9.72-level represents the 38.2% retracement level, and it remains to be seen if WAVES can reclaim it as a level of support. The MACD showed strong bearish momentum. The trading volume saw an increase as the price fell, showing market conviction. More losses were likely to follow, but there was an area of demand at $9.3 that the market’s bulls could look to defend.
Dash [DASH]
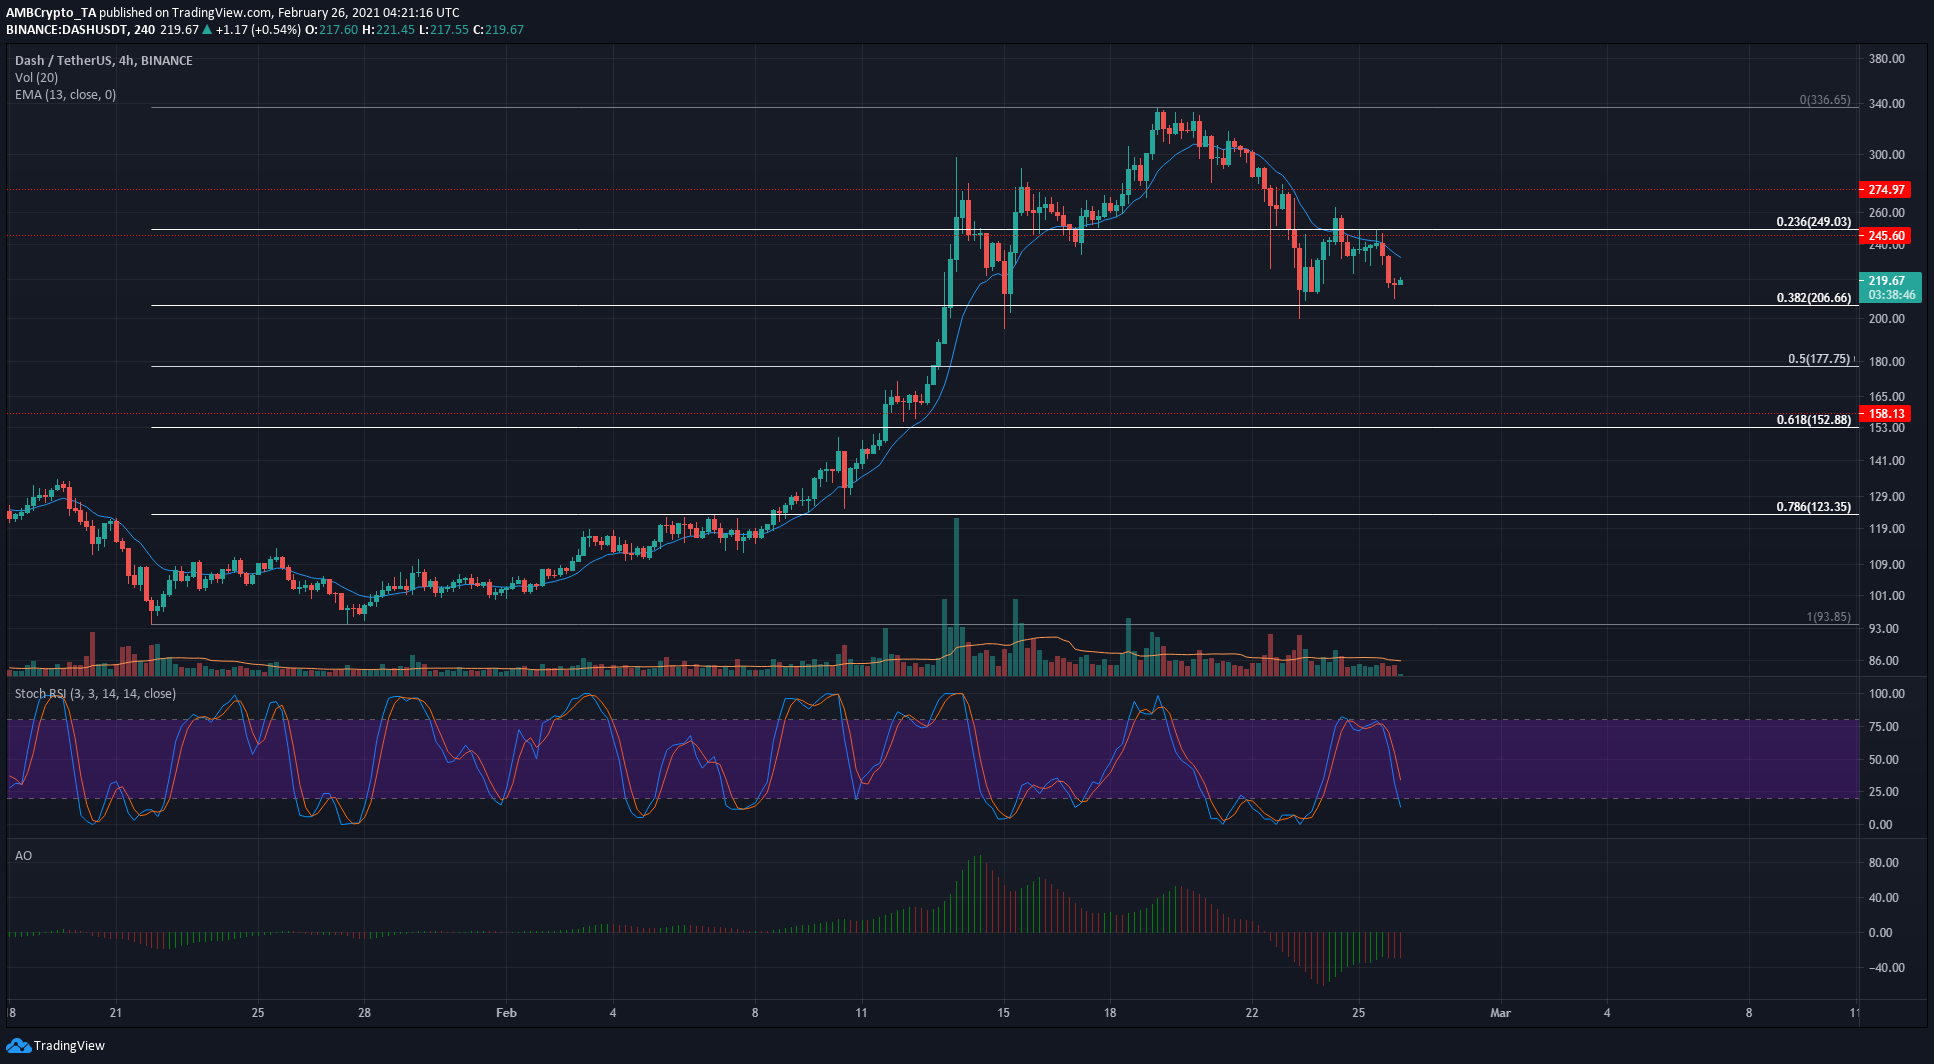
On the 4-hour chart, the 13-period EMA was above DASH on the charts, highlighting strong southbound momentum for the price. Once more, the retracement levels highlighted areas of importance.
This would be the second test of the $200-level within a week for DASH should the price descend further. DASH’s bulls would seek to affect a bounce above $230 to not imperil the psychological $200-level. The Awesome Oscillator registered red bars under zero to show rising bearish pressure once more, while the Stochastic RSI also dropped.
A bounce off the $200-$210 level is possible, but it could turn out to be only a bounce. The market’s bulls would need to drive the price above $240 to keep the bears in check.