Understanding BONK’s 68% spike: Is this just the beginning?
If the bulls can continue this performance, the 78.6% Fibonacci retracement level would likely serve as support.

- BONK saw social metrics expand as prices soared higher in the past two days.
- The 78.6% Fibonacci level was a make-or-break level.
Bonk [BONK] saw its social dominance surge higher by fivefold within two days over the weekend. AMBCrypto’s analysis of the Santiment data showed that the memecoin saw increased attention from market participants, but not all of it was positive.
A recent AMBCrypto report noted that BONK saw its trading volume surge higher alongside prices. The token bounced by 67.7% from the lows it set on the 19th of April. Have the bulls turned a corner?
The weighted sentiment stayed resolute
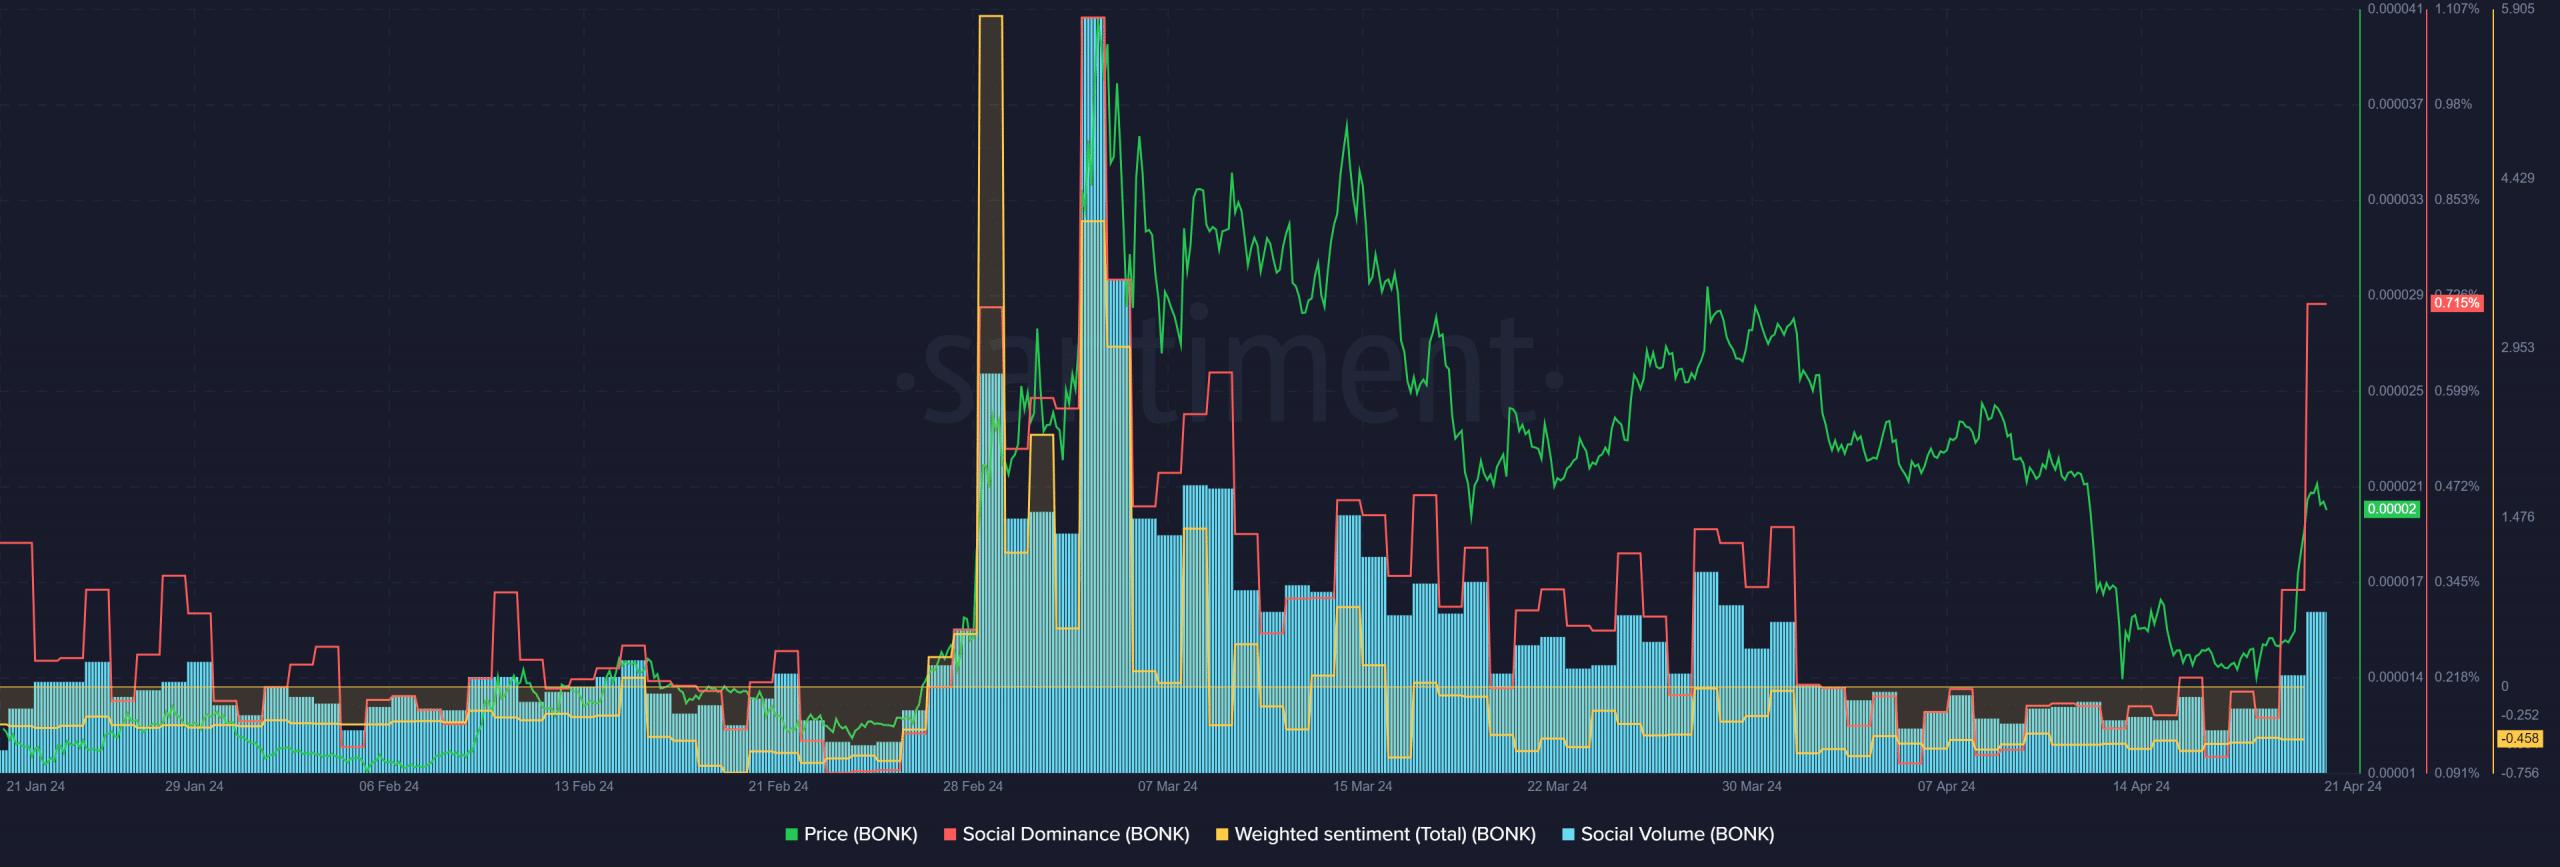
As BONK prices jumped from $0.000014 to $0.0000214, the social volume also climbed higher. The social dominance rose from 0.165% on the 19th to 0.715% on the 21st, a nearly 5x increase.
Yet, the weighted sentiment behind BONK remained in the negative territory. This showed that the social media engagement was negative, despite the price performance in the short term. This indicated a lack of belief in the memecoin.

The Open Interest rose from $130 million to $219 million when prices expanded northward. This showed that speculators were eager to capture some of BONK’s gains and had a short-term bullish outlook.
However, during the rally, the funding rate was negative. Additionally, the aggregated liquidations showed many short positions were liquidated during the move upward, fueling prices higher.
Is the rally organic, and where should buyers enter if it is?

The trading volume picked up over the past two days. Therefore, even though the derivatives market likely pushed prices higher, the trading activity also played a part. It is possible that bulls might begin a recovery.
The CMF was at +0.25 at press time and signaled significant capital flow into the market.
Realistic or not, here’s BONK’s market cap in BTC’s terms
The RSI also pushed back above the neutral 50 mark to show bullish momentum.
If the bulls can continue this performance, the 78.6% Fibonacci retracement level would likely serve as support, as it did in mid-March. Defending this area is crucial for the buyers.