Uniswap, Bitcoin SV, Litecoin Price Analysis: 04 May

Uniswap found support at the 200-SMA and some buying activity was noted around the $40-mark. Bitcoin SV bounced back from $341 after a minor pullback but this area would need to be defended once again. Lastly, Litecoin presented mixed signals at the time of writing. A bullish outcome would see LTC rise north of $300, while a bearish downturn could push it all the towards $250.
Uniswap [UNI]

Source: UNI/USD, TradingView
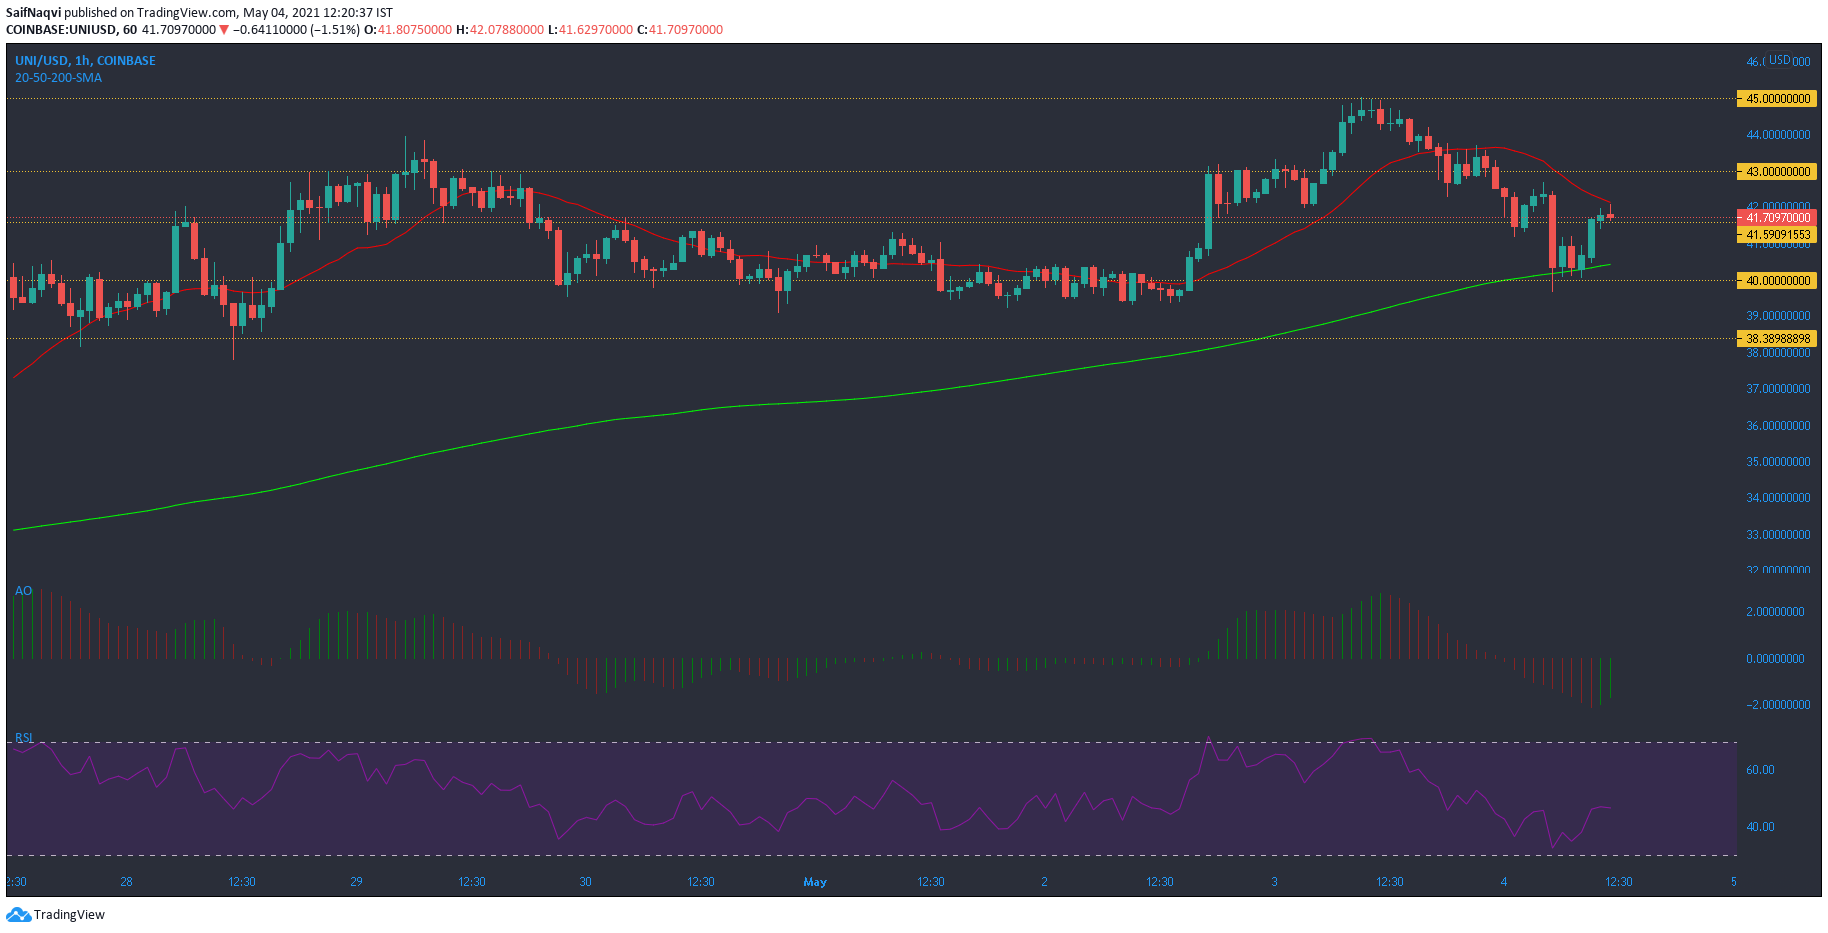
After touching the $45-mark, some selling occurred in the Uniswap market as the price moved south. The hourly timeframe captured the bearish move and showed a dip towards the 200-SMA (green) close to $40. Buyers stepped in at this level and pushed the price above $41.5, but there was some resistance in the form of the 50-SMA (red). Awesome Oscillator noted some bullish momentum but it was unlikely whether this would continue to drive UNI above $43 in the coming sessions.
RSI bounced back before touching the oversold zone and headed towards neutral 50. A jump above $43 would likely see the bulls recapture $45, but bullish cues were required from the broader market.
Bitcoin SV [BSV]

Source: BSV/USD, TradingView
An ascending triangle breakout showed gains of nearly 10% from the upper trendline of the pattern and a minor pullback post the breakout was cushioned around $341-support. While the hourly charts on Bitcoin SV showed some buying around the present defensive line, the 4-hour timeframe highlighted some bearish momentum.
Awesome Oscillator registered two red bars and the bulls might need to defend the $341-level once again. Even MACD closed in on a bearish crossover. In case of a breakdown, there lay some support around $308-310 and buyers could step in at this level.
Litecoin [LTC]

Source: LTC/USD, TradingView
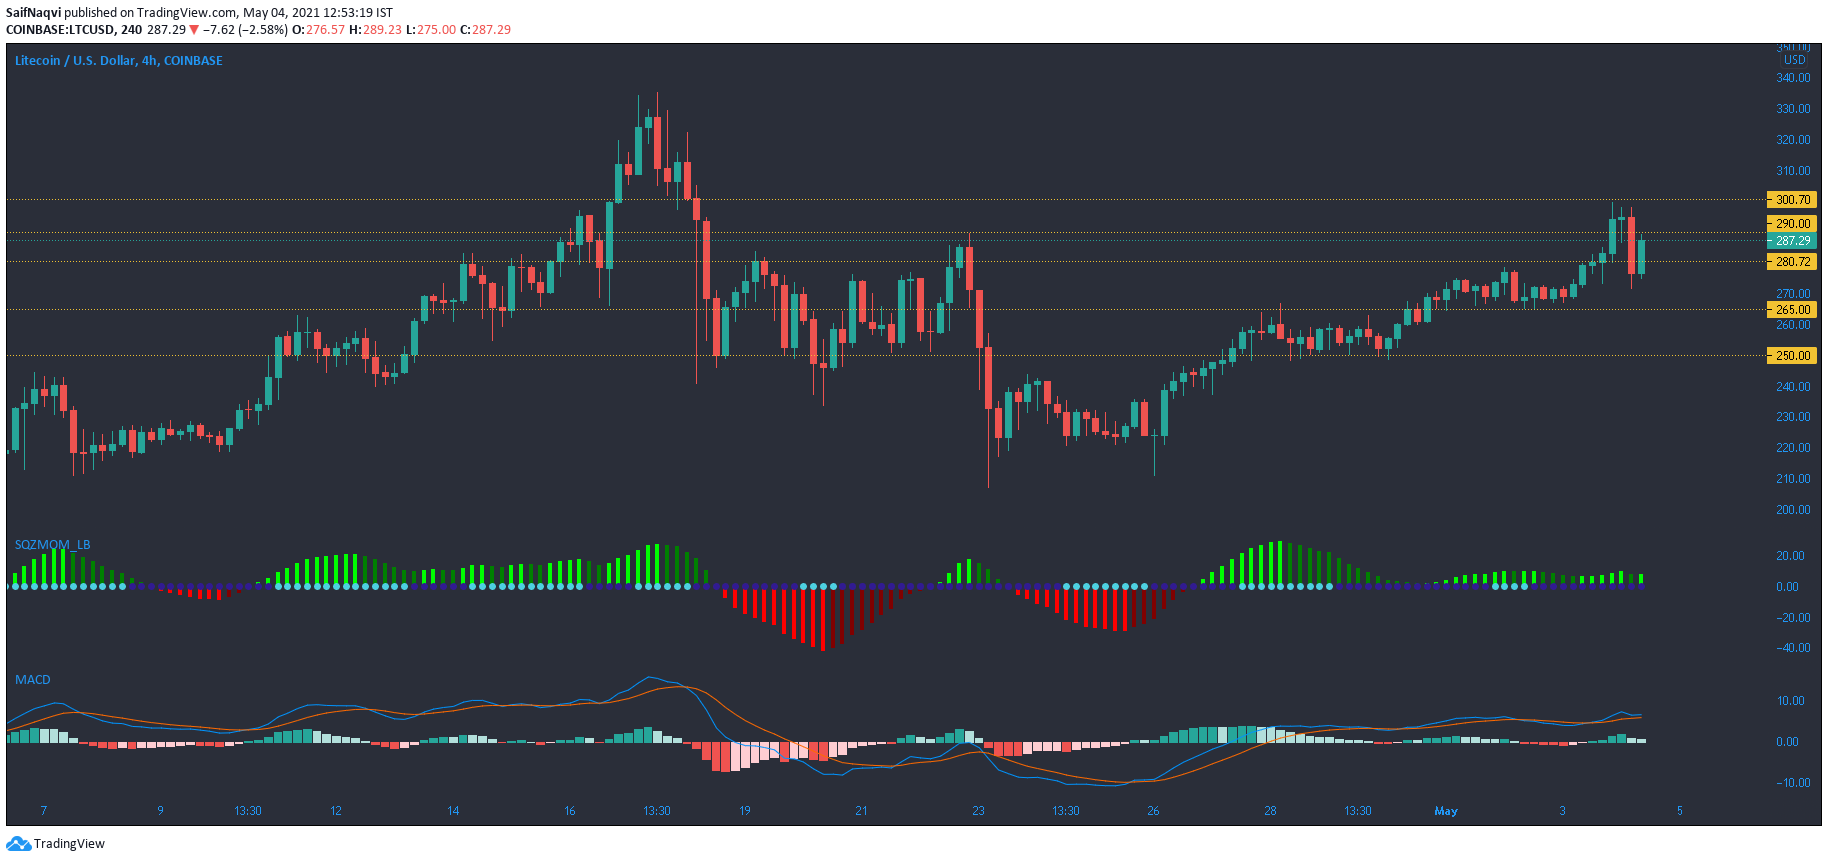
A candlewick surged as high as $300 but the bears were swift to react and pushed Litecoin back below $290. According to the Squeeze Momentum Indicator, the market was currently in an extended squeeze, with momentum on the bullish side. Once the squeeze is released, the first light blue dot and a green bar would present a buy signal. This would likely see LTC head back towards the $300-level. Conversely, a light blue followed by a red bar would present a sell signal.
Since MACD was on the verge of a bearish crossover, LTC might see another dip in the coming sessions. This would highlight support lines at $265 and $250.


