Uniswap, Crypto.com Coin, Compound Price Analysis: 07 March

Uniswap broke out past the $29.3 level of resistance, while Crypto.com Coin was in a phase of consolidation. Compound bounced off the $450 level of support to touch $500 but could see a pullback to $470.
Uniswap [UNI]

Source: UNI/USDT on TradingView
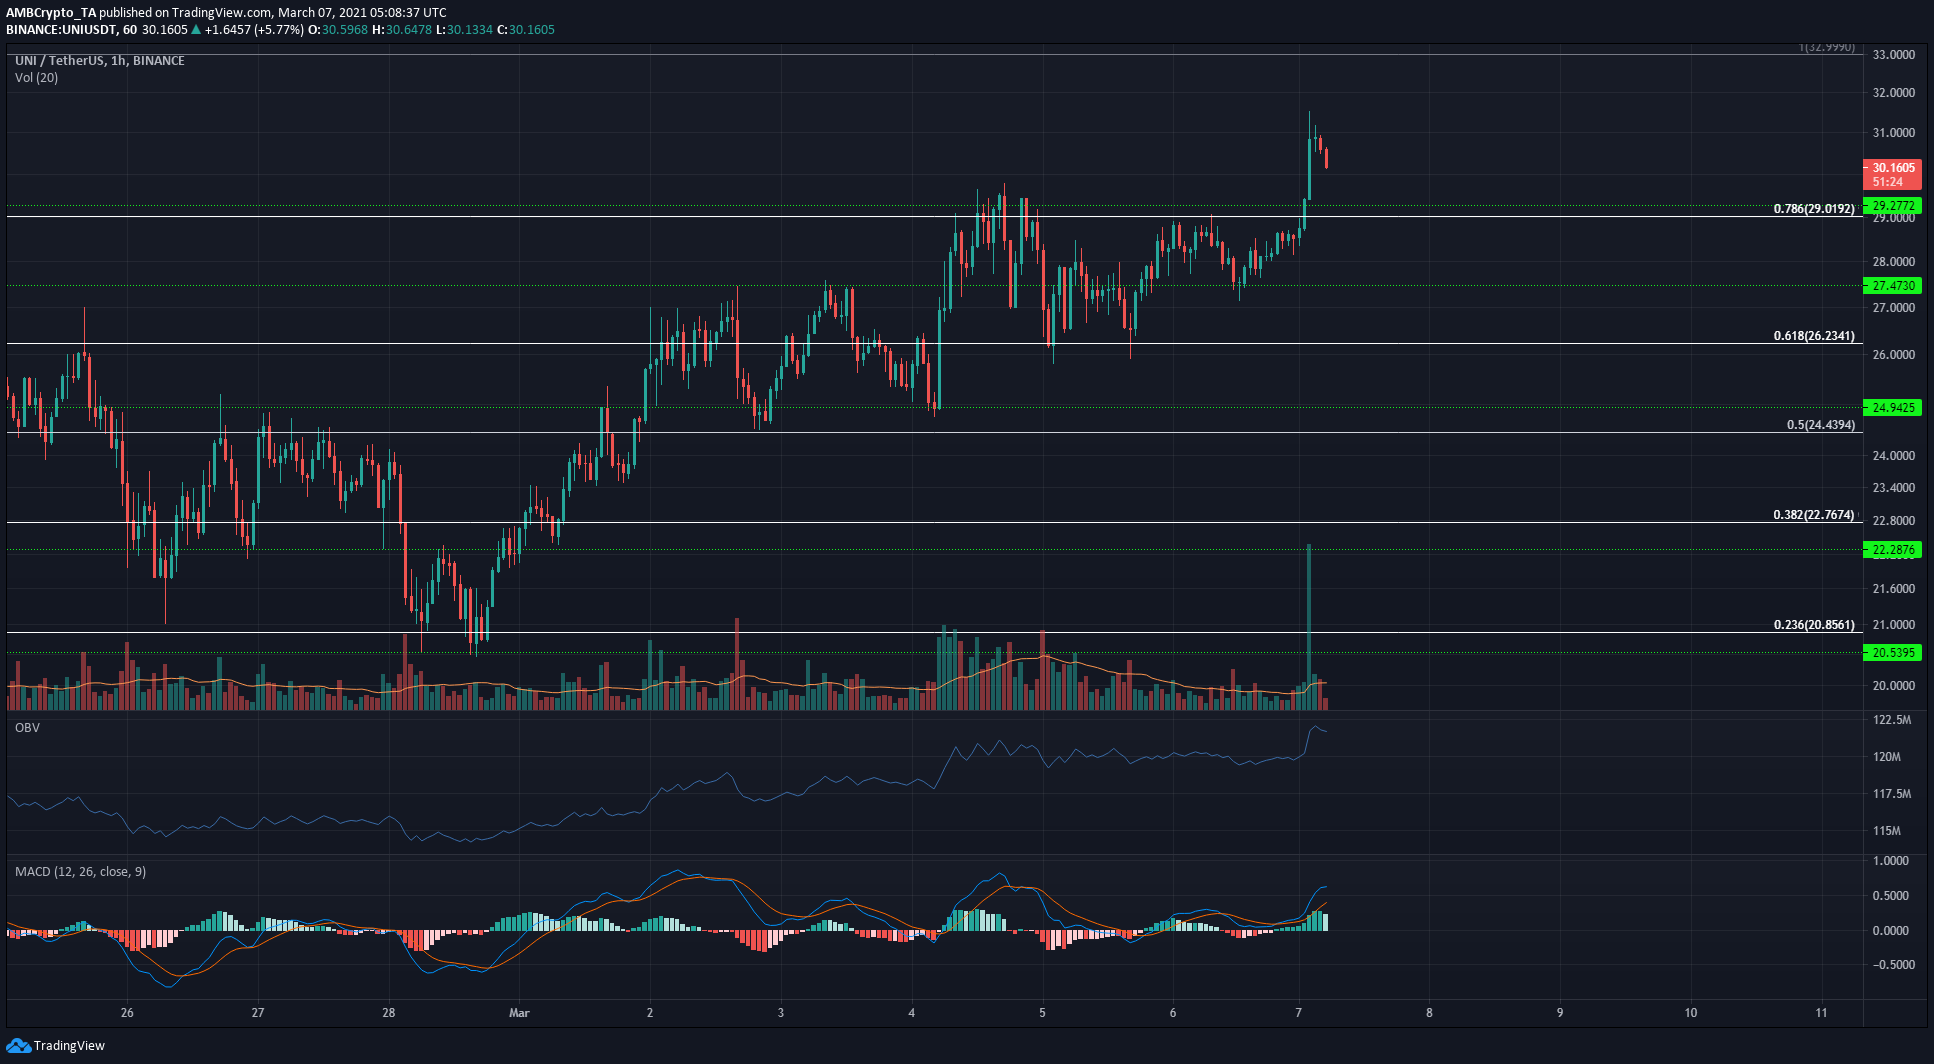
UNI broke out and went past the $29 area of resistance, where the 23.6% retracement level and the $27.3 level of resistance lay. The upward move had extraordinary volume as UNI touched $31.54 but some selling pressure was seen in the subsequent trading session.
The Doji candle represented short-term exhaustion from the bulls, and the breakout could see UNI pullback to test the $29.3 level to confirm its flip from resistance to support.
The MACD showed strong bullish momentum behind UNI. Bearish divergence on the hourly chart between momentum (MACD) and the price could be seen in the coming hours, which would likely see UNI pullback to $29.4. This can be used to enter long positions, with a stop-loss just at $28.7.
Crypto.com Coin [CRO]

Source: CRO/USDT on TradingView
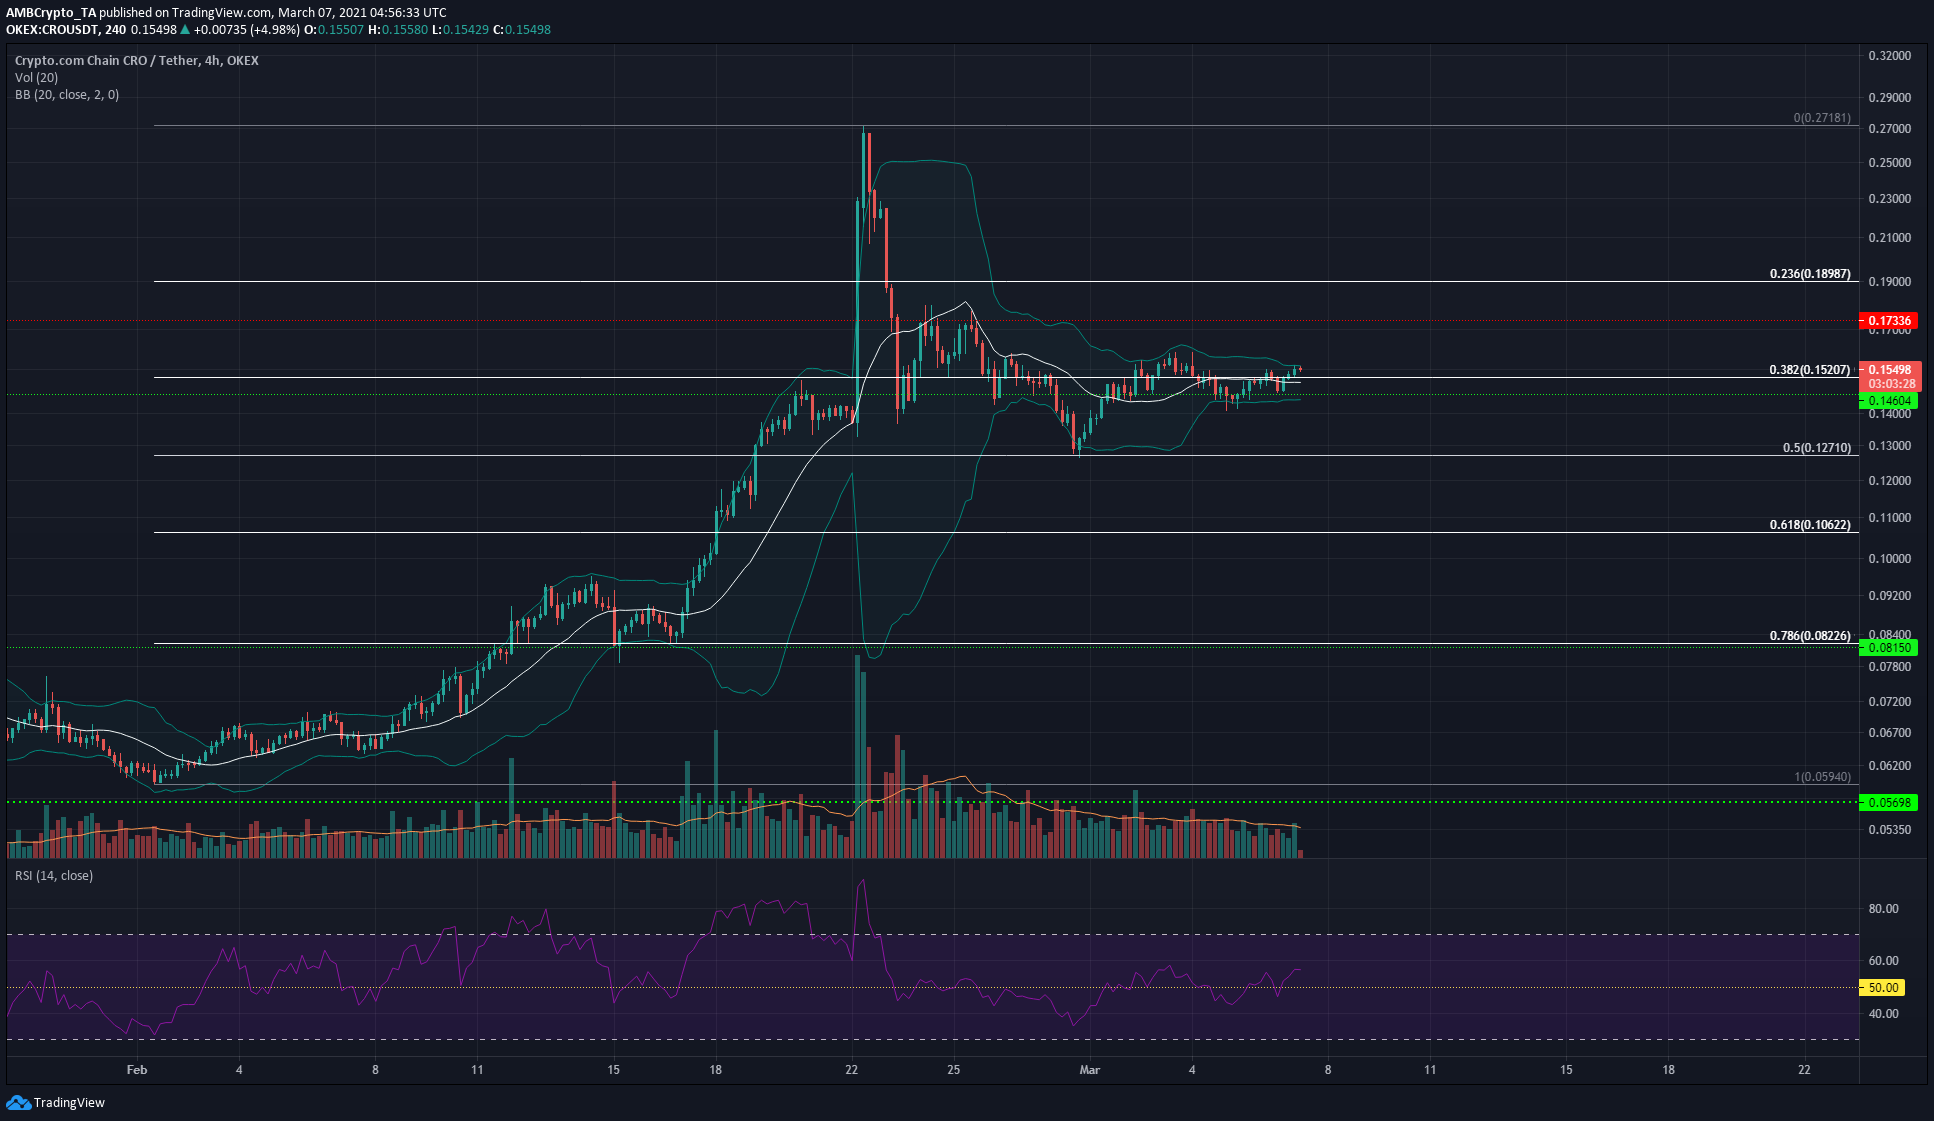
The Bollinger bands showed that CRO was in a phase of consolidation at and around its 38.2% retracement level at $0.152. The RSI moved back above neutral 50 to indicate that momentum was swaying towards the bulls’ side.
The defense of the 50% retracement level at $0.127 and the immediate bounce-off was a show of strength from bulls – the $0.146-$0.152 region can be used to accumulate CRO in expectation of another move upwards. The $0.173 and $0.189 levels are levels of resistance to watch.
Compound [COMP]

Source: COMP/USDT on TradingView
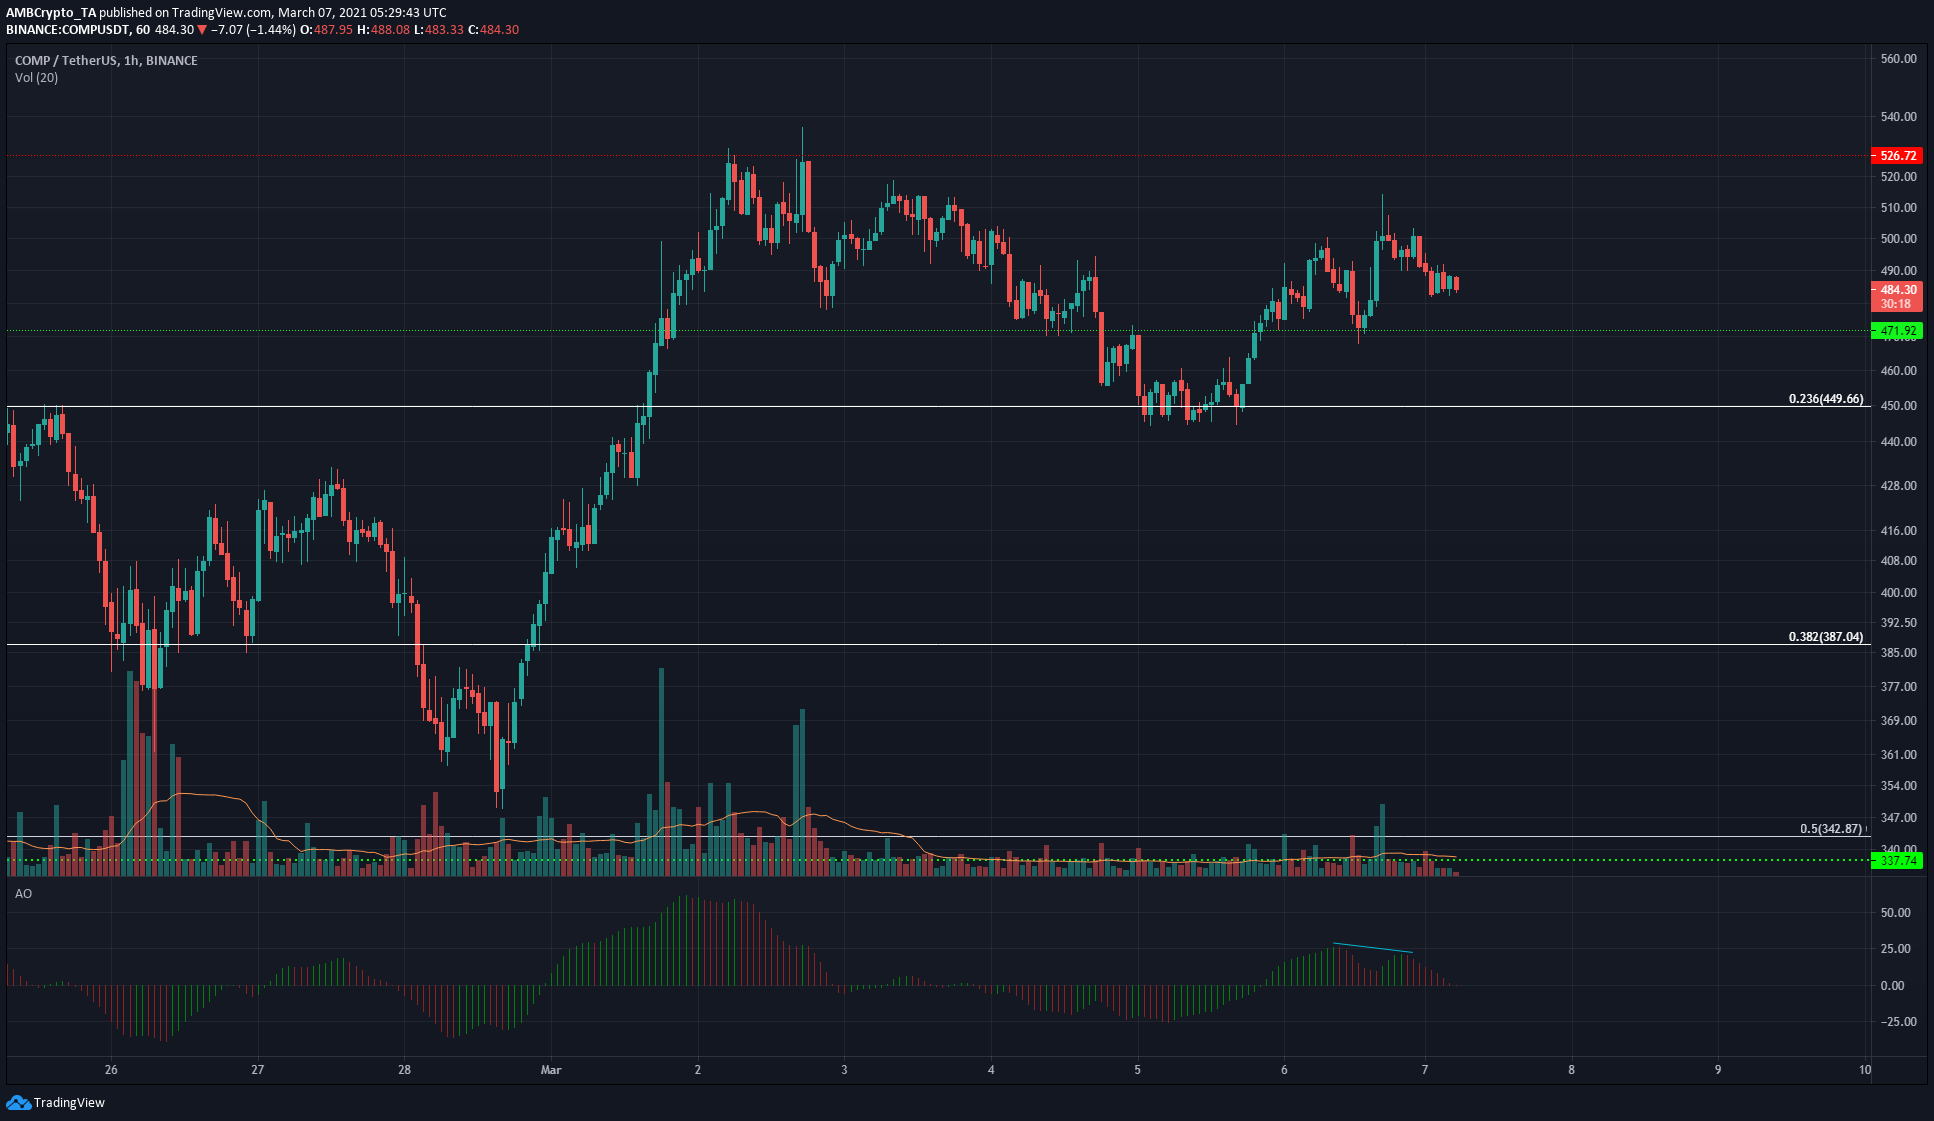
Compound saw a strong bounce-off at the $450 mark which represents a 23.6% retracement for COMP’s move from $205 to $573. At the time of writing, COMP faced some resistance at the $500 area.
Moreover, the Awesome Oscillator on the hourly chart displayed a bearish twin peak set up and gave a sell signal. This development, followed by the AO registering bearish bars on its histogram, is likely to see the price dip to $470. Bulls would need to show some strength at $470, or bears can drive the prices lower to $450 once more.


