Uniswap, Ethereum, Binance Coin Price Analysis: 23 May

The global cryptocurrency market was yet to recover from the recent onslaught that saw most coins head towards their March-April lows. Ethereum was in danger of further retracement all the way towards $1,300 in case of a breakdown from $2,000. Uniswap threatened to drop as low as $6.54, while Binance Coin did the same.
Uniswap [UNI]
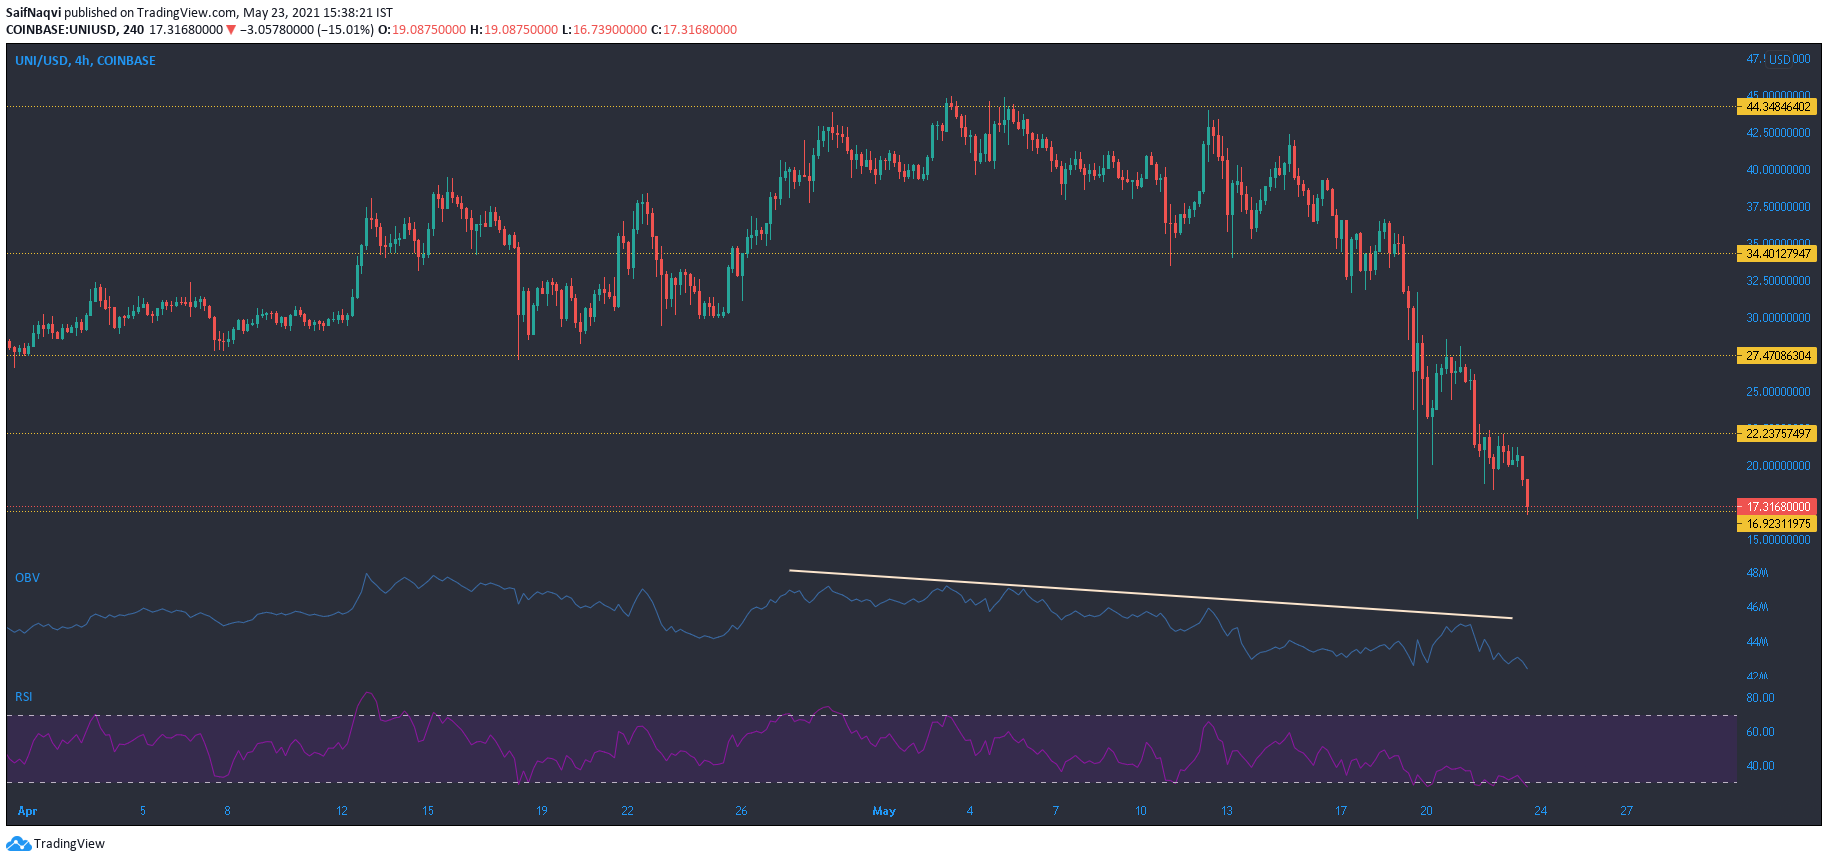
Uniswap’s On Balance Volume painted a rather dire picture once it achieved record highs above $44. OBV’s downtrend highlighted selling pressure and even though UNI held on to higher levels, it failed to break above its ATH. This already flashed warning signs prior to crypto sell-off.
Now below multiple support lines, UNI moved towards a defensive line at $16.9 but another breakdown was expected. Additional support marks reside at January lows of $9.82 and $6.54. RSI traded in oversold territory and even though a slight bounce can be expected, the index would likely visit this area multiple times over the coming days.
Ethereum [ETH]
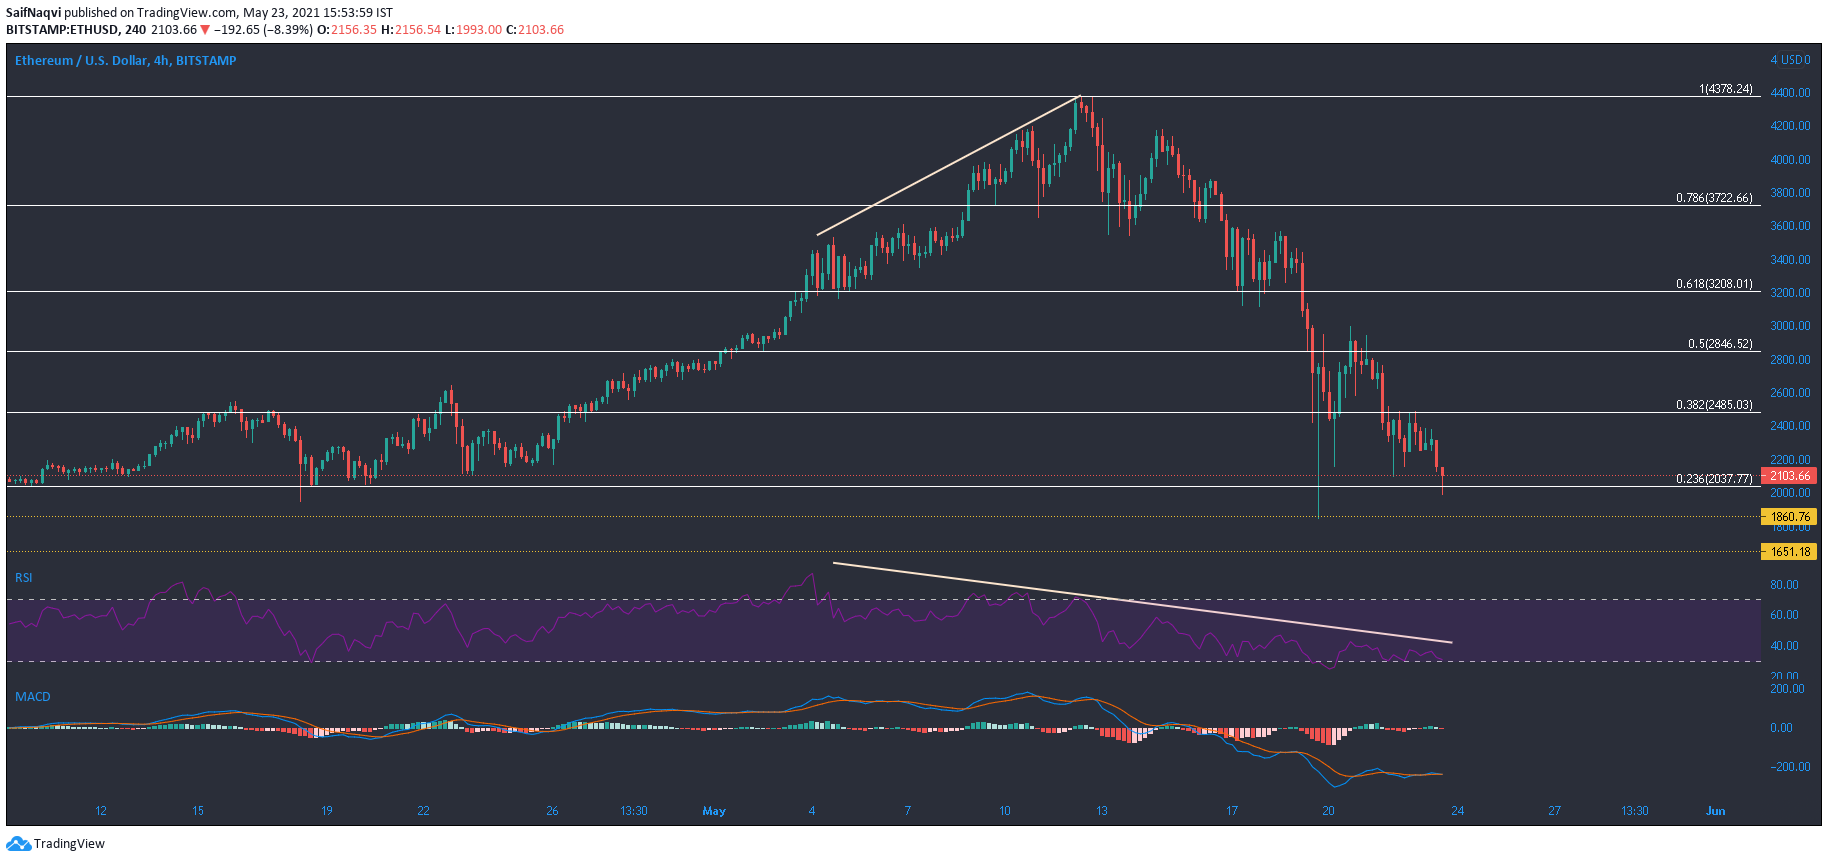
Ethereum’s pullback in late February was used as a reference point to highlight potential support lines via the Fibonacci tool. The 23.6% Fib level ($2,037) indicated a buy zone but a breakdown seemed likely considering a weak broader market. A revisit of February lows could see the world’s largest altcoin drop all the way towards $1,300. A couple of relief points lay at $1,860 and $1,650 where some sideways movement can be expected in case of a move below $2,000.
RSI’s downwards trajectory was expected during considering the crypto beatdown. It also indicated that the market was severely overbought and needed stabilization. MACD was well below equilibrium and in bearish territory.
Binance Coin [BNB]
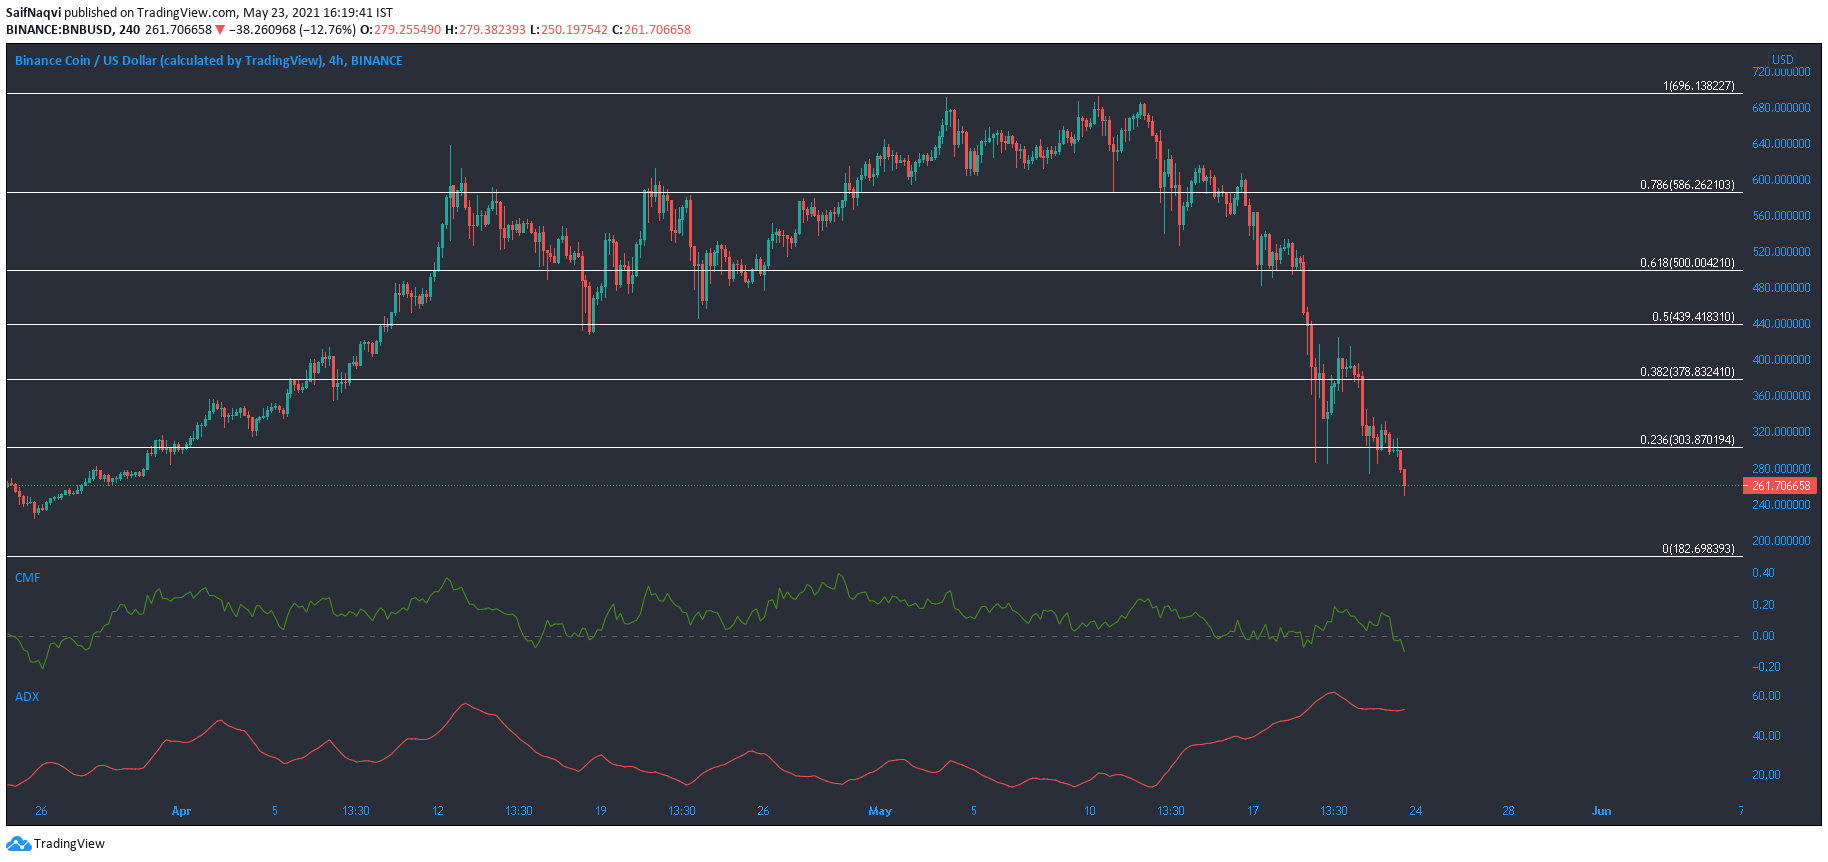
Binance Coin broke below its 23.6% Fibonacci level ($303) and traded at $267 at the time of writing. The next prominent support mark lay around $182- an area that provided relief during BNB’s retracement in end-February. Losses made over the past few days dropped BNB to the 6th position in crypto rankings. In fact, Dogecoin’s market cap was now larger than that of BNB’s by $2 Billion.
A few buy zones lay between $220-260 but their reliability was uncertain under such bearish conditions. Chaikin Money Flow dropped below half-line as capital outflows did not trump inflows. An ADX reading of over 50 highlighted a powerful bearish trend.