Uniswap, Stellar, Litecoin Price Analysis: 05 January

Defying the broader sentiment, UNI poked above the 61.8% resistance level whilst Stellar formed a cup and handle pattern on its 4-hour chart. On the other hand, Litecoin continued its sideways movement. However, all the aforementioned cryptos flashed a weak directional trend.
Uniswap (UNI)
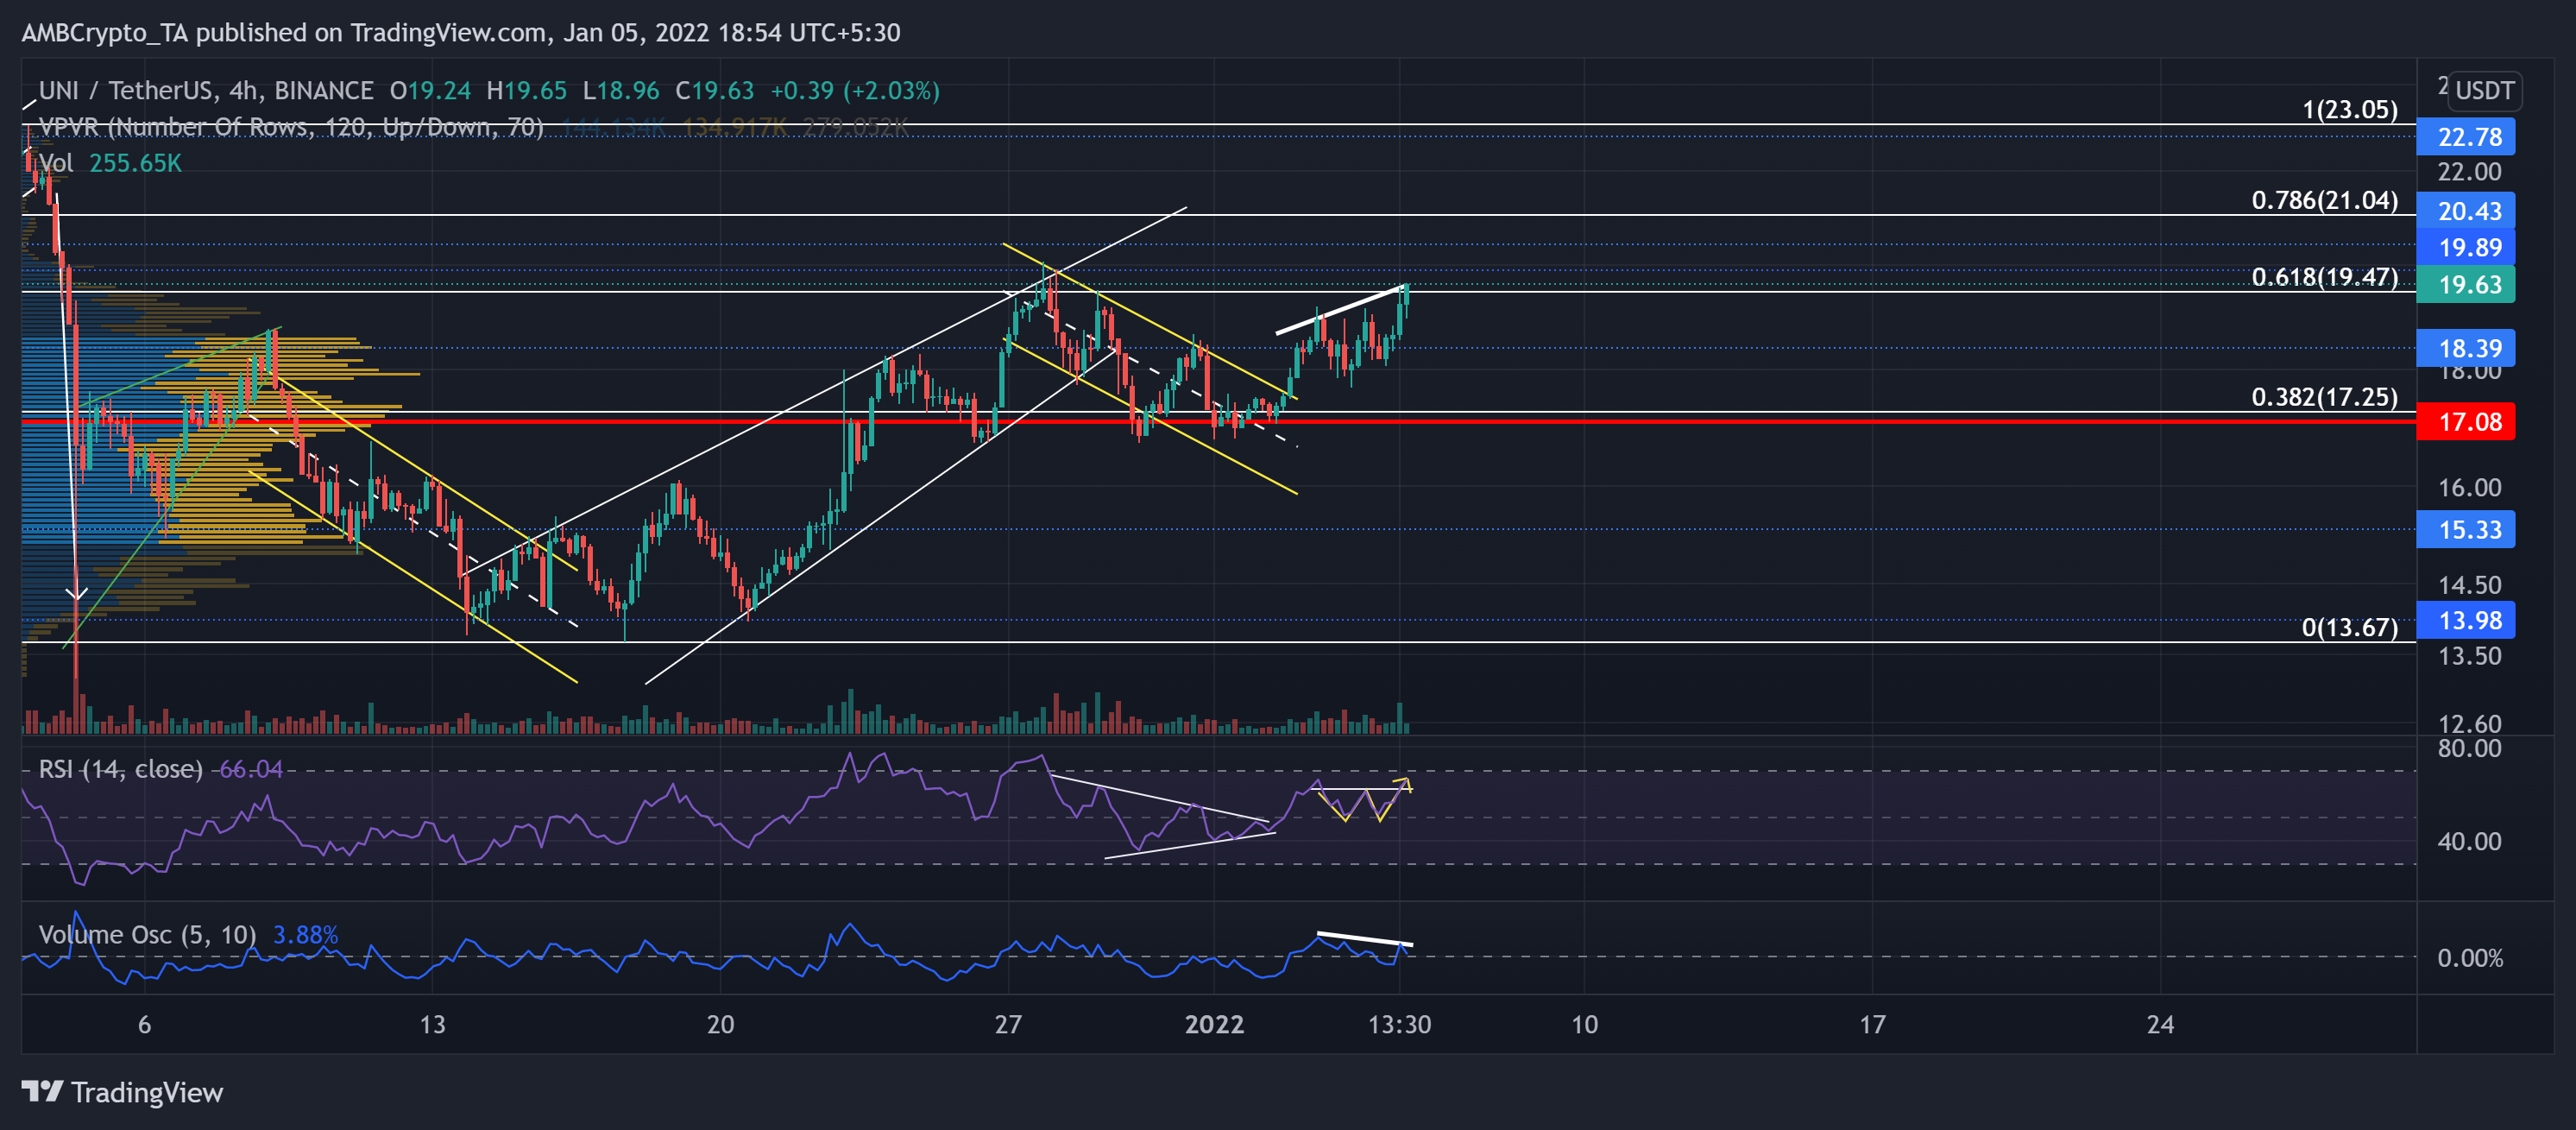
UNI’s long-term bearish streak reversed from the crucial 11-month support at the 13.98-mark. The rising wedge (white) saw a breakdown from the golden 61.8% Fibonacci level.
This fall found support at the Point of Control (red) near the $17.07-mark. Accordingly, the alt witnessed a 13.47% down-channel breakout and found resistance at the 61.8% Fibonacci level.
At press time, the alt traded at $19.63 after noting a 5.23% 24-hour gain. After a symmetrical triangle breakout, the RSI found support near the half-line and displayed a bullish bias. Now, it surged to test the overbought region after forming a double bottom. However, the Volume Oscillator refrained from marking higher peaks.
Stellar (XLM)
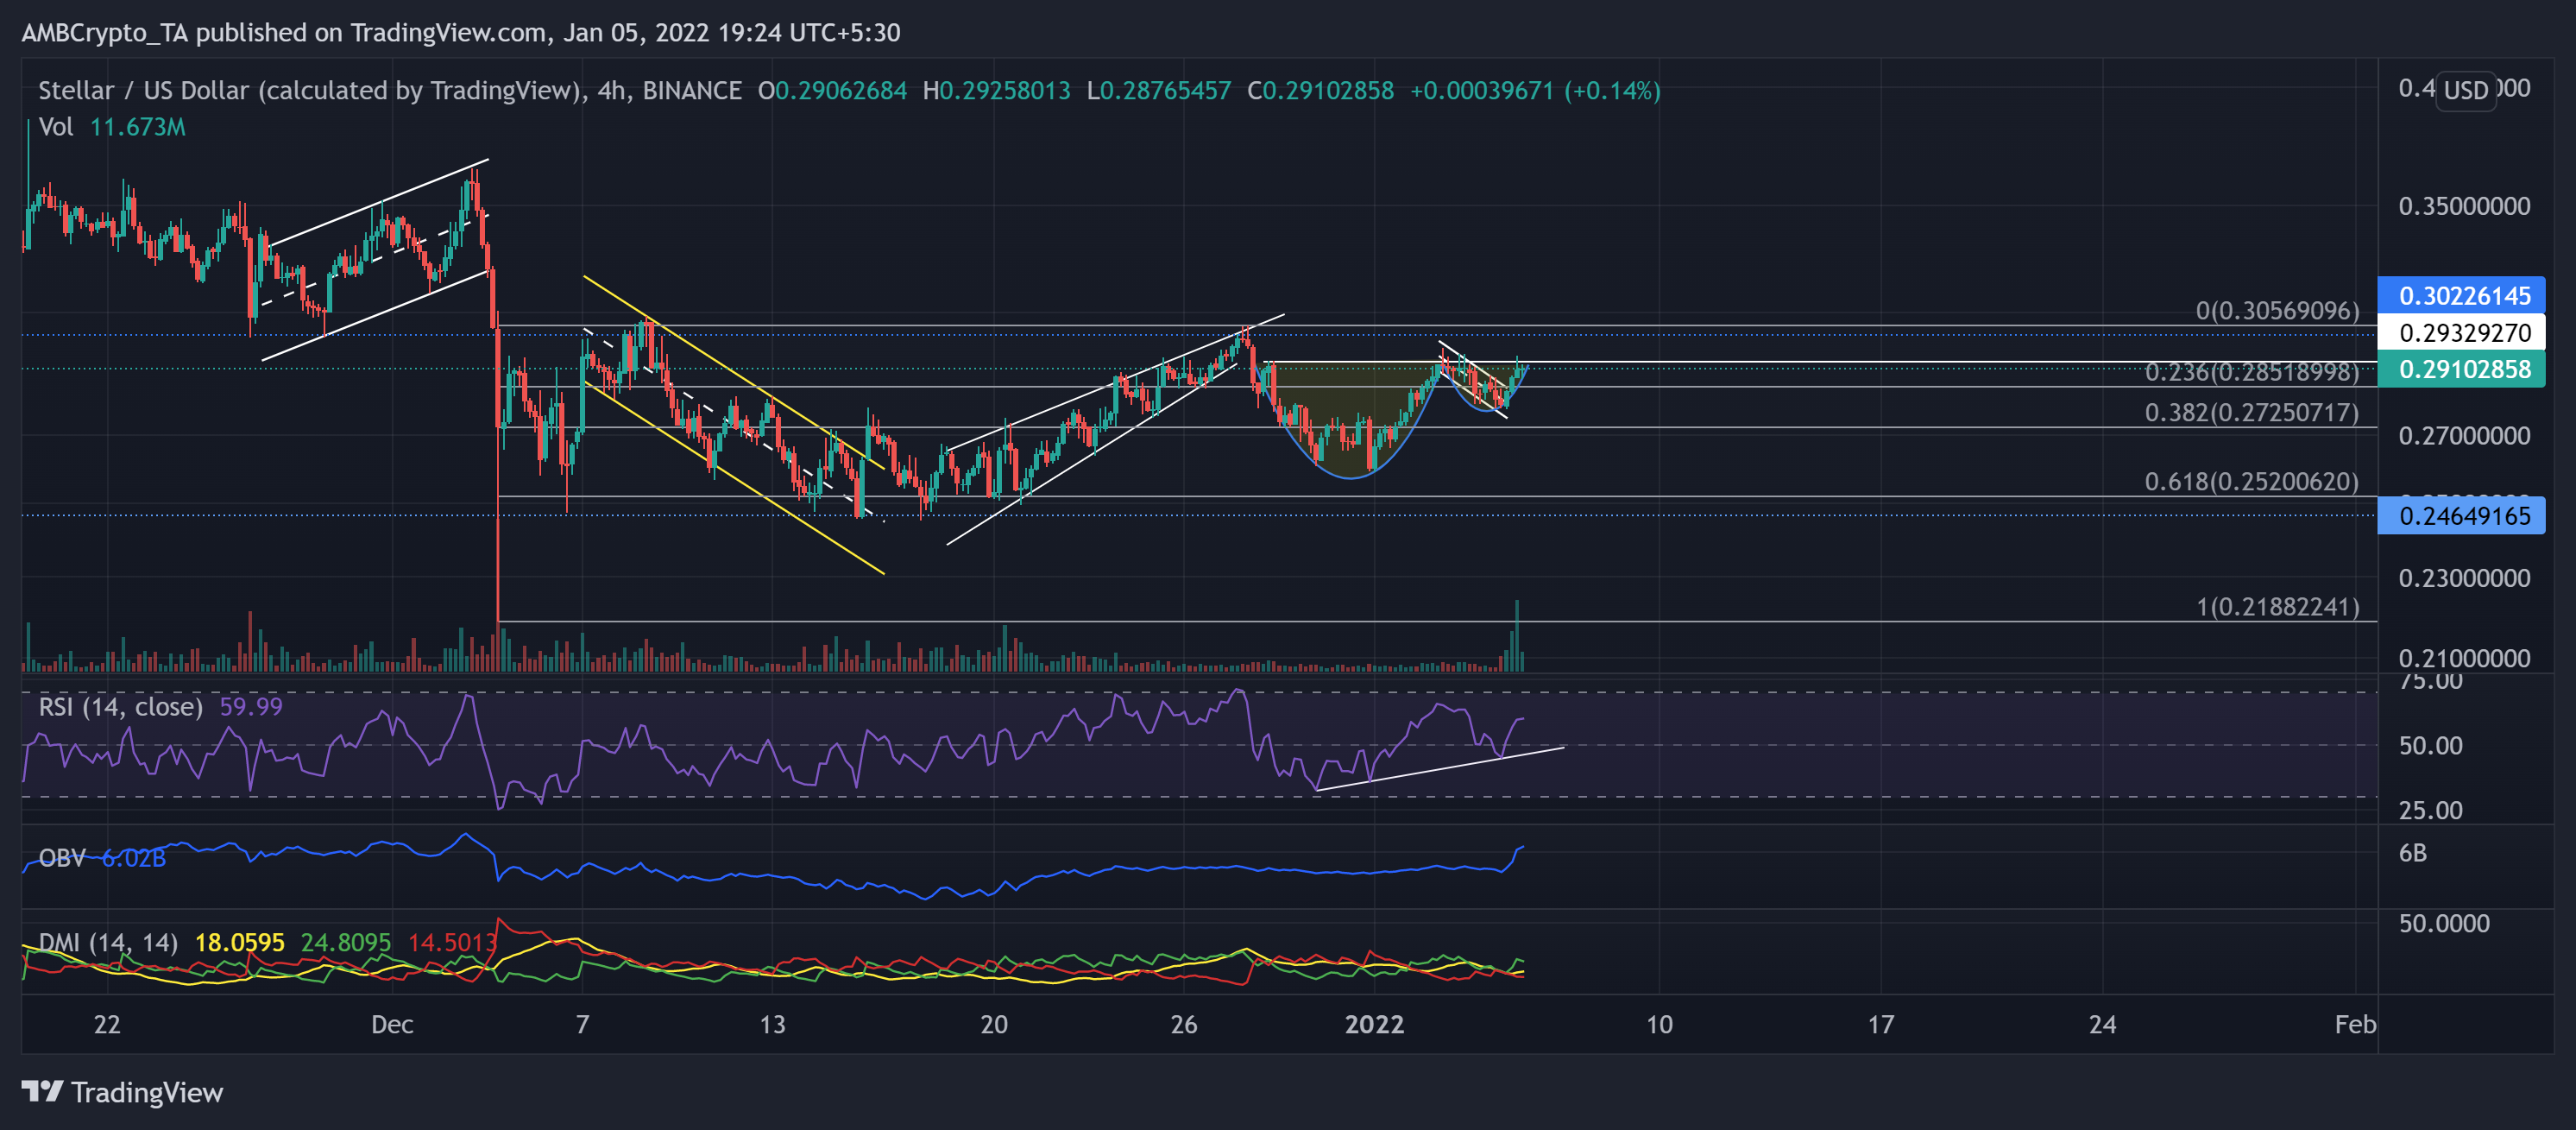
Since the up-channel (white) breakdown on 3 December, XLM lost nearly one-third of its value but ensured the 24-week support at the $0.2464-level. Consequently, it rose in a rising wedge (white) to find test the $0.3022-mark resistance.
Now, over the past week, XLM witnessed a classic cup and handle (bullish) pattern on its 4-hour chart. The volumes and the OBV corresponded with the recent green candles, confirming a strong bullish move.
At press time, XLM traded at $0.291. The RSI was in an uptrend over the past week and swayed in favor of the bulls. Further, the DMI reaffirmed the bullish influence, but the ADX displayed a weak directional trend for the alt.
Litecoin (LTC)
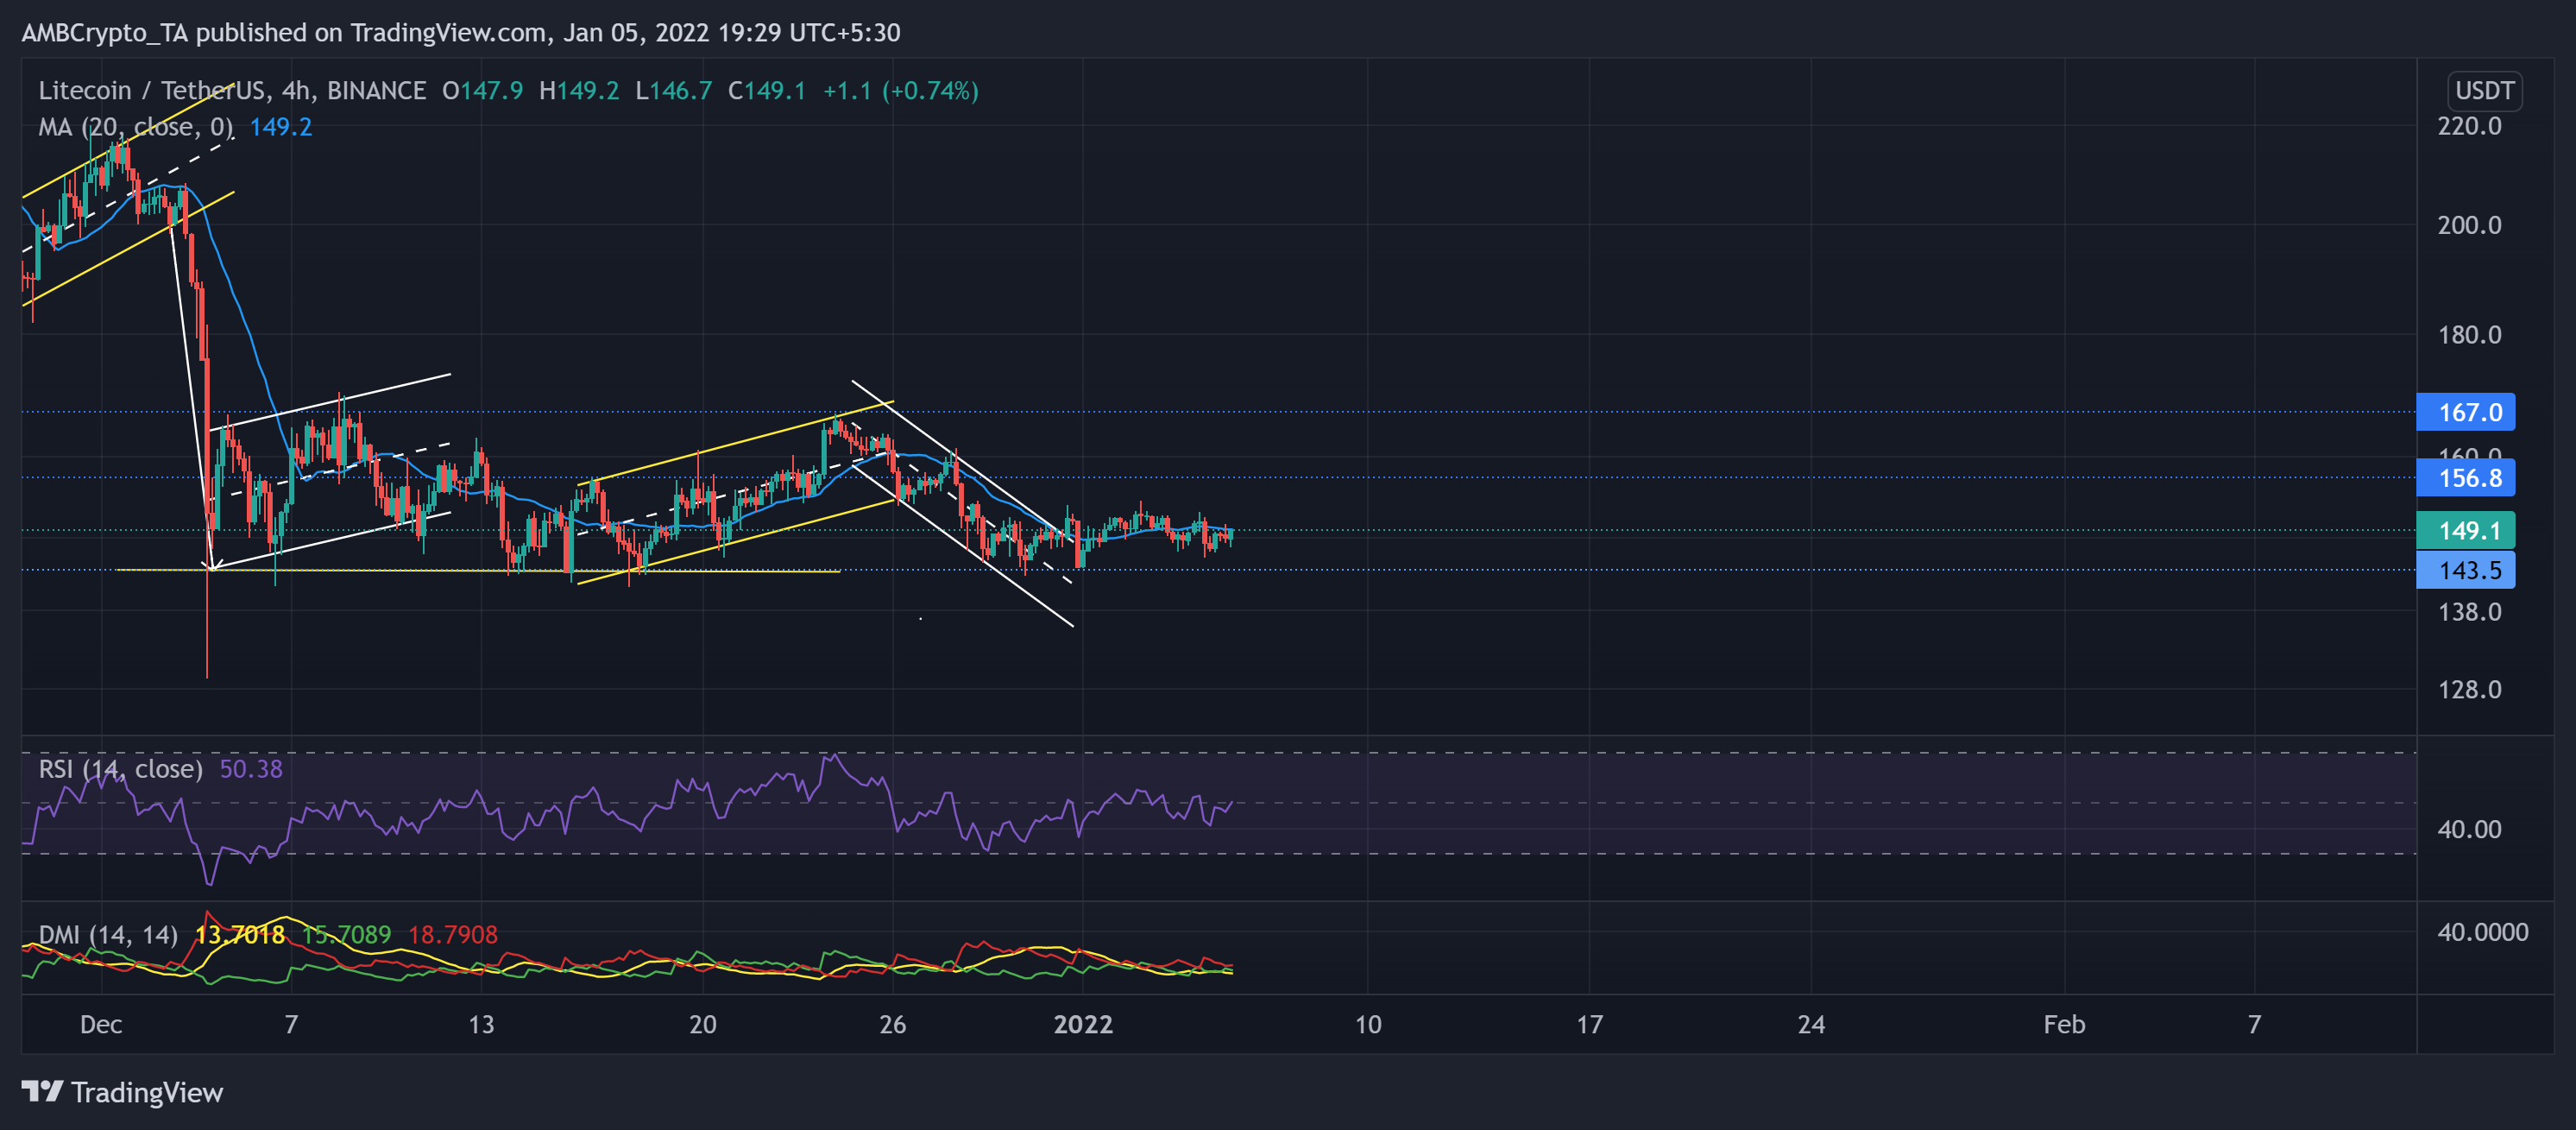
LTC managed to find an oscillating range between the $167 and $143-mark over the last month. Since the down-channel breakout, the price moved sideways after flashing low volatility.
The bulls upheld the $143 support level for nearly five months now while the bears kept retesting it multiple times. Now, the immediate hurdle for the bulls stood near the 20-SMA (cyan).
At press time, LTC traded at $149.1. The RSI struggled to mark a convincing close above the half-line for the past ten days. Also, the DMI flashed a bearish bias while the ADX displayed a weak directional trend.