Solana at a crossroads, which way will it go from this key support level
Solana registered a series of lower highs over the past two months. The $190-$200 demand area was respected in November and saw a good bounce to $235, but that area has since succumbed to bearish pressure. Solana was at a crossroads once more, with $170 being a strong area of support.
Bitcoin could also see a bounce from the $45.8k area, which would likely have a positive impact on the market. But can the bulls stall the longer-term downtrend? Or will we see SOL trading at $150 or $120 a few months later?
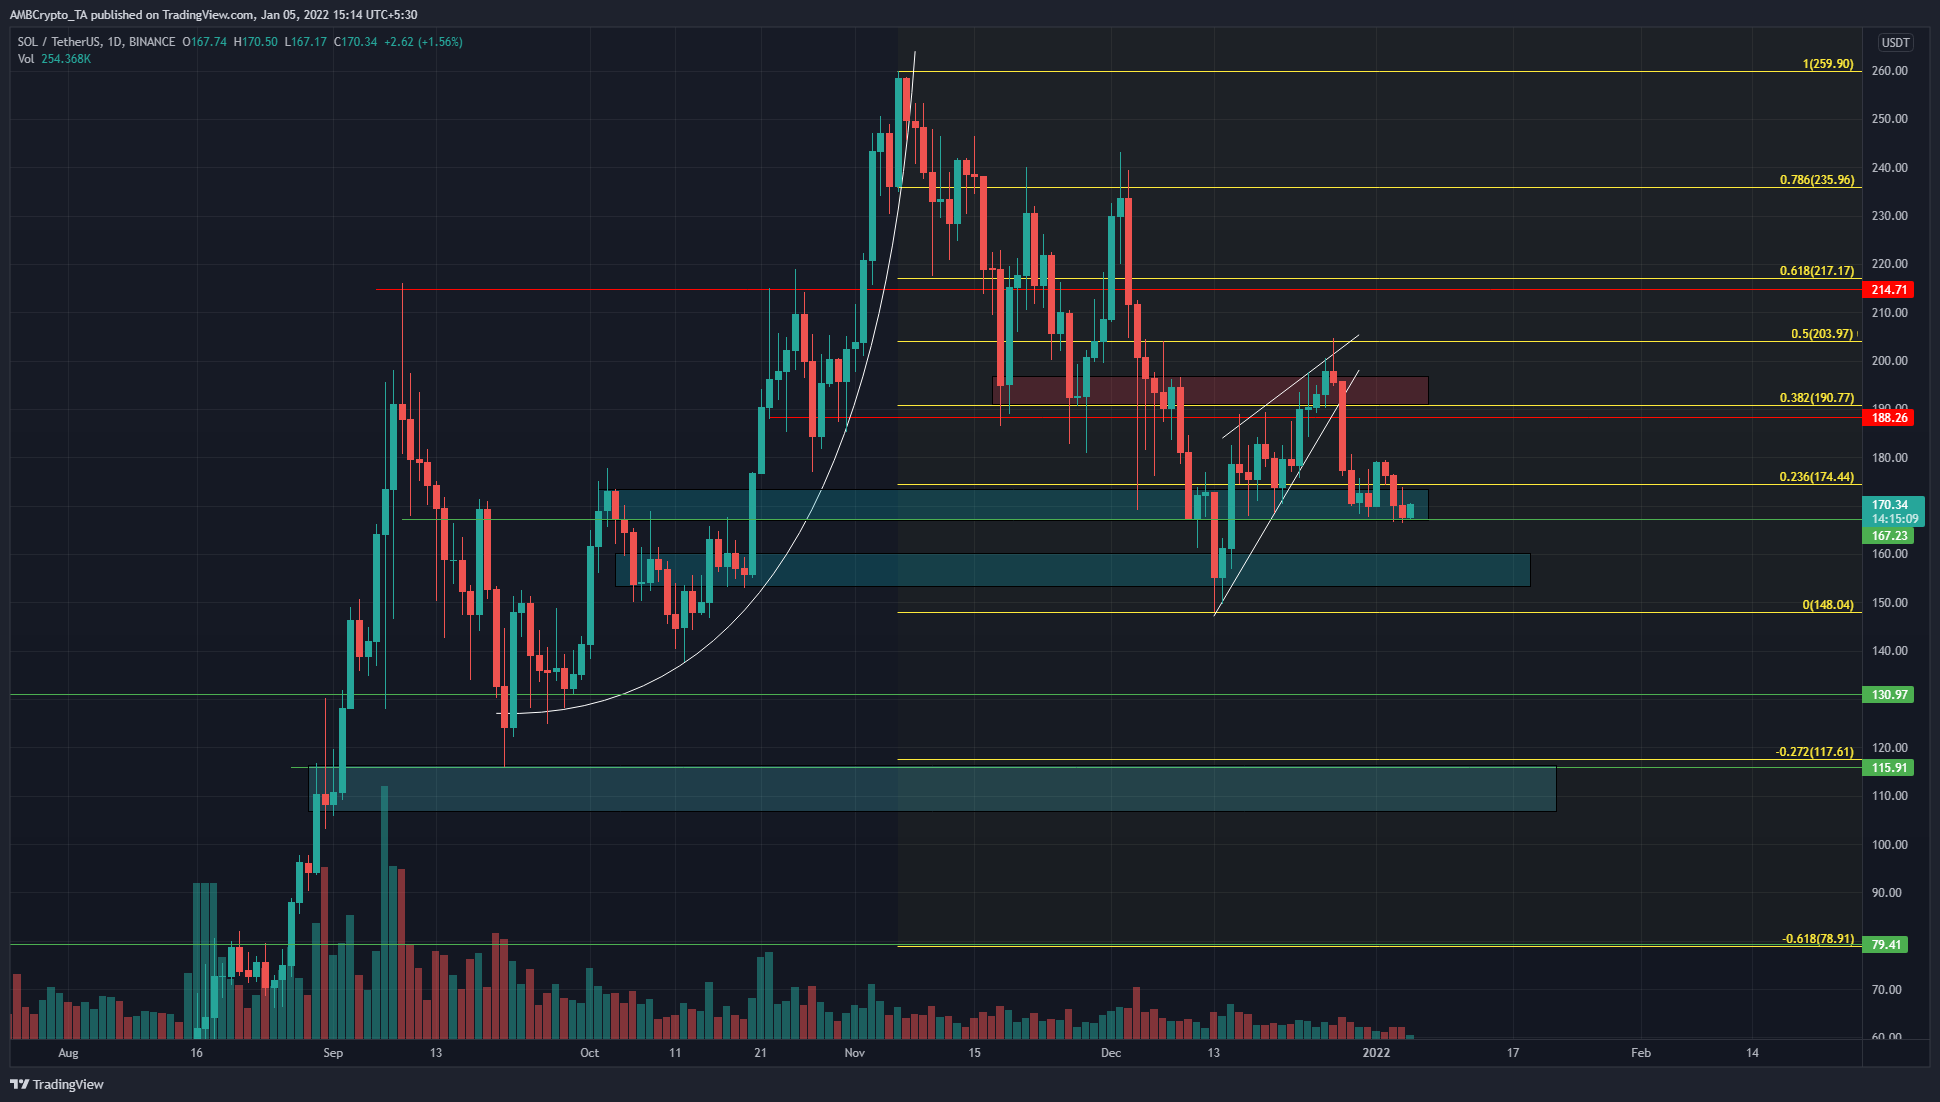
Solana went parabolic in September and kept climbing that way till late October. The swing high (and ATH) at $259.9 and the swing low at $148 were used to plot Fibonacci retracement levels, as well as extension levels.
In the first half of December, SOL formed a rising wedge and ran into the $203 resistance level, which was just above the $190 area (red box) which had acted as supply over the past month. Subsequently, the price broke downwards out of the wedge and was right atop another level of support at $167.
The cyan boxes highlight areas of previous demand, where the price was likely to get a reaction from the buyers. These areas lie at $170, $153-$159, and $107-$115. In particular, the 27.2% and 61.8% extension levels line up very well with significant levels of support.
Rationale
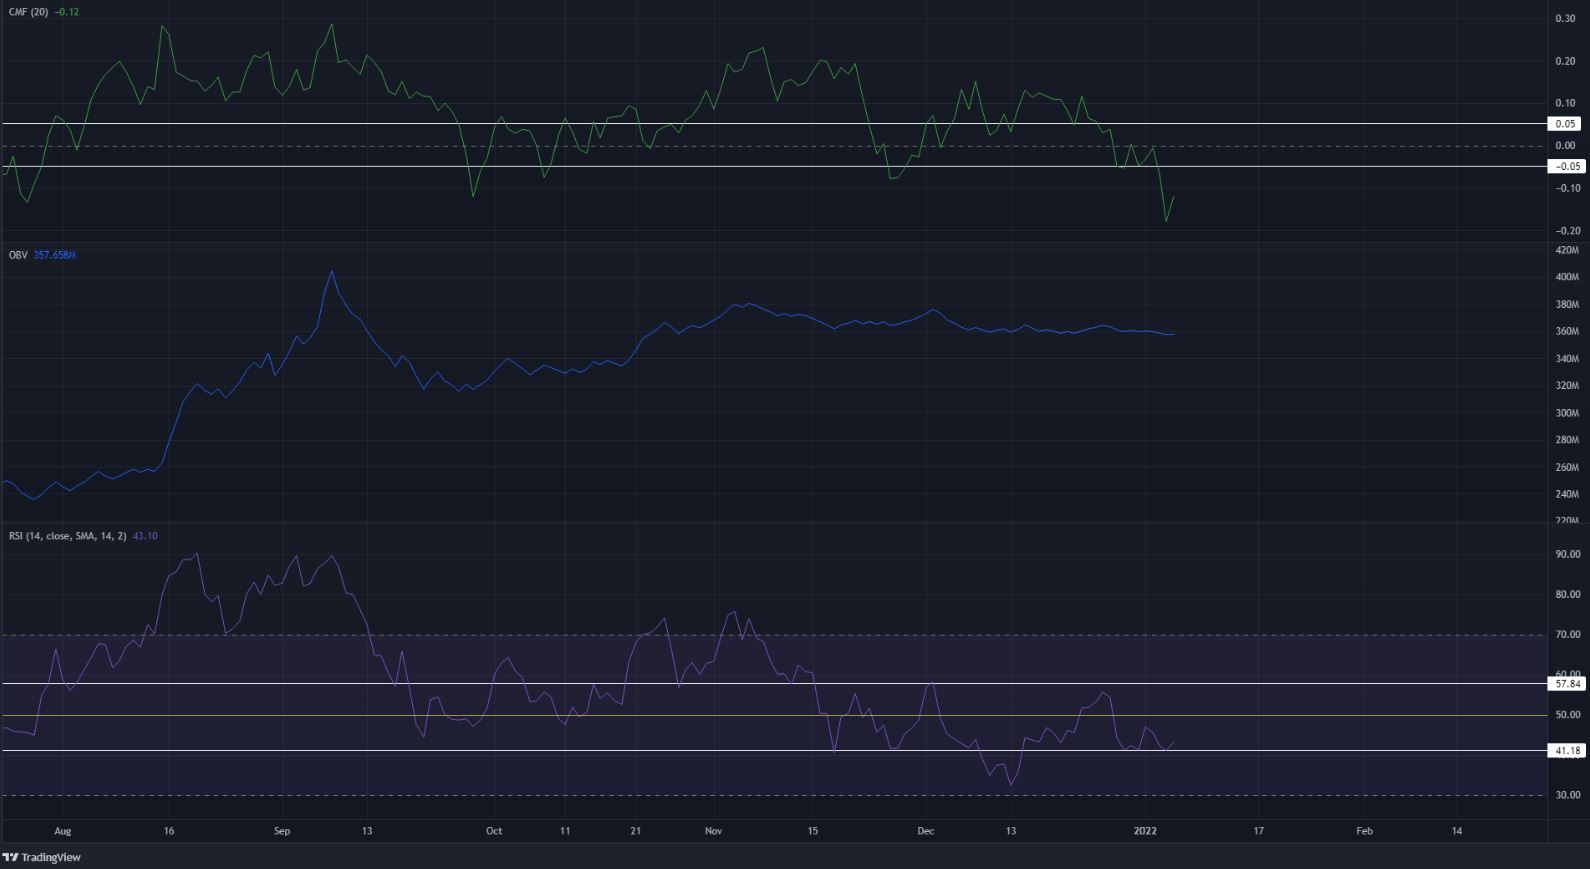
The Chaikin Money Flow dropped sharply beneath -0.05 and showed that capital flow was heavily directed out of the market. The OBV has also been headed downward which indicated steady selling.
The RSI bounced from 41, which has held as a level of support in the past. A drop below this value has correlated with intense selling. Yet the RSI continued to move below neutral 50, which showed bearish momentum on the daily chart.
Conclusion
Was it too early to declare Solana would reach $100? Definitely. For Solana, the price action of the past few months was a downtrend, with some impulse bullish moves in between on lower timeframes. This indicated that rallies were for selling, and dips were for buying.
It was likely that we could see another test of the $150 area if Bitcoin faced significant selling pressure over the next week or so.