Uniswap, THETA, Tron Price Analysis: 17 May

Uniswap projected further losses in case of a break below 36.5-$34.4 support. THETA’s cut-off point for bullish control lay between $7.88 and $8.44. Finally, Tron traded within a descending triangle and a 30% retracement loomed large.
Uniswap [UNI]
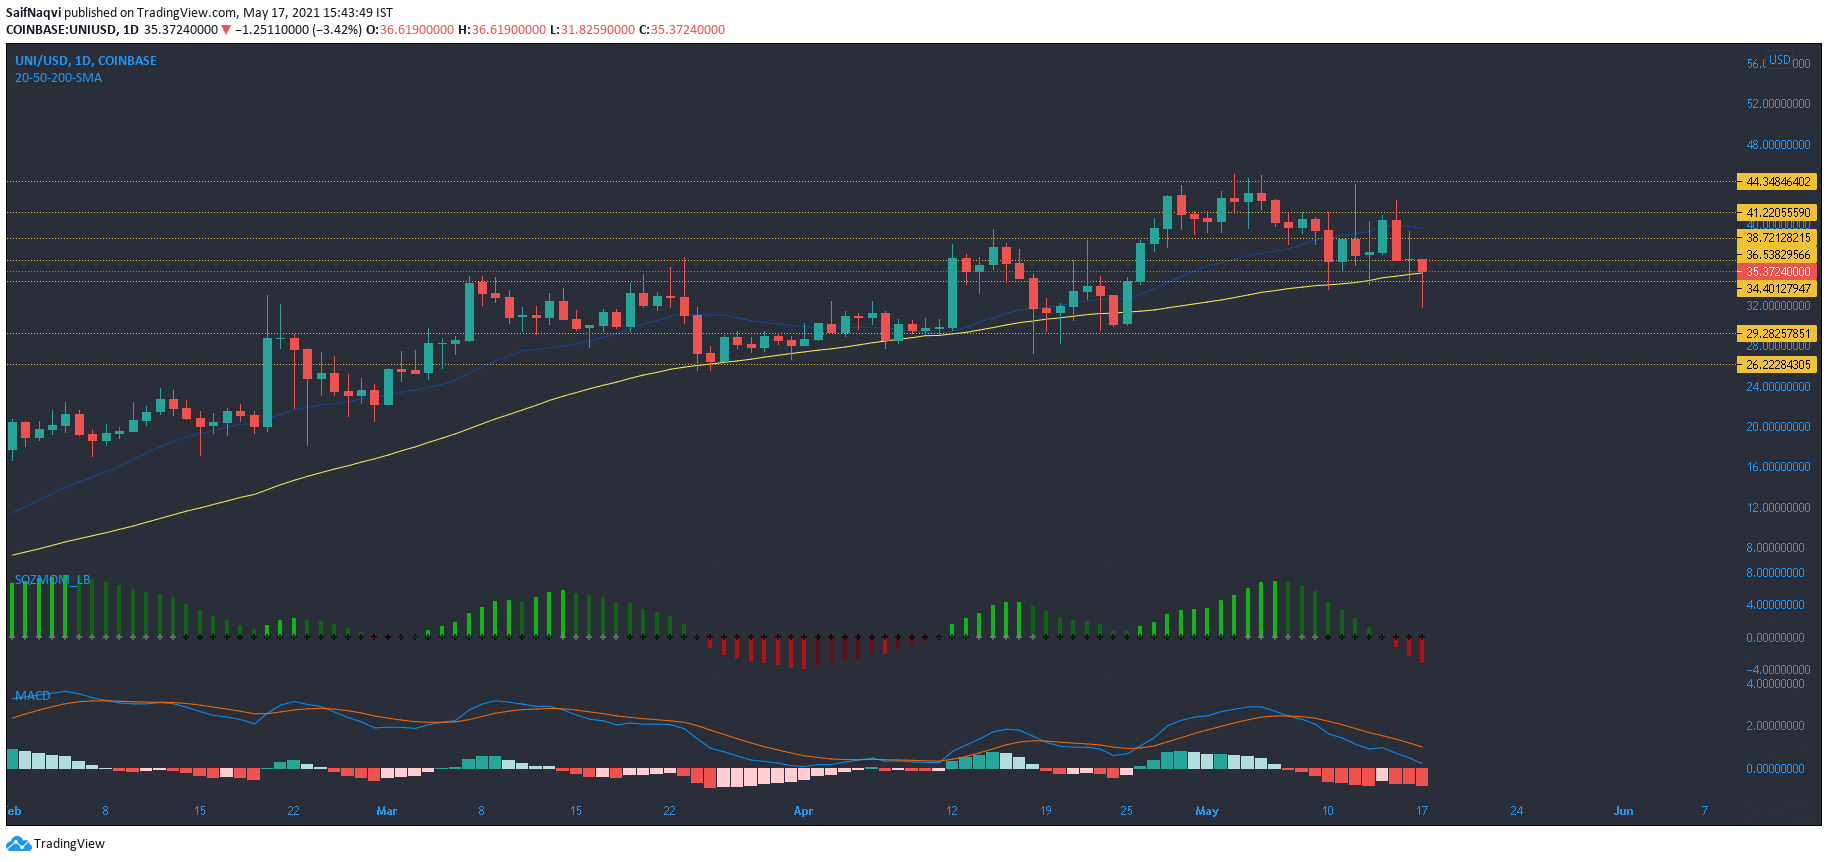
A doji candlestick spotted on yesterday’s close signaled an abrupt end to what looked like a recovery in the Uniswap market. At press time, UNI traded within a buy zone of $36.5-$34.4. This area clashed with the 50-SMA (yellow) on the daily timeframe. Losing this critical region could see more southbound action towards $29-30. This outcome would indicate a 15% retracement from the present support mark.
Squeeze Momentum Indicator highlighted selling pressure and a series of white dots would indicate high volatility and sharper losses. MACD was in danger of slipping below the half-line. The last time MACD dropped below its equilibrium was back in December 2020 when UNI languished around $4.5.
THETA

THETA maintained consolidatory movement over the last 24 hours. The region between $7.88 and $8.44 was an important boundary and ceding this to the bears could trigger a 22% fall to $6.41 support- a level previously seen in mid-March. Although unlikely, a stronger sell-off could occur towards $4.8 and the 200-SMA. Long-term traders could lap up THETA at this discounted price level.
Bearish pressure was evident in the market according to Awesome Oscillator’s red bars. In fact, these conditions have been prominent since April end after THETA failed to break above $14.6. RSI traded in bearish territory below 45. For a bullish comeback, levels to reclaim were $12.4 and $13.8. A jump above $14.6 on strong volumes would point towards a price hike.
Tron [TRX]
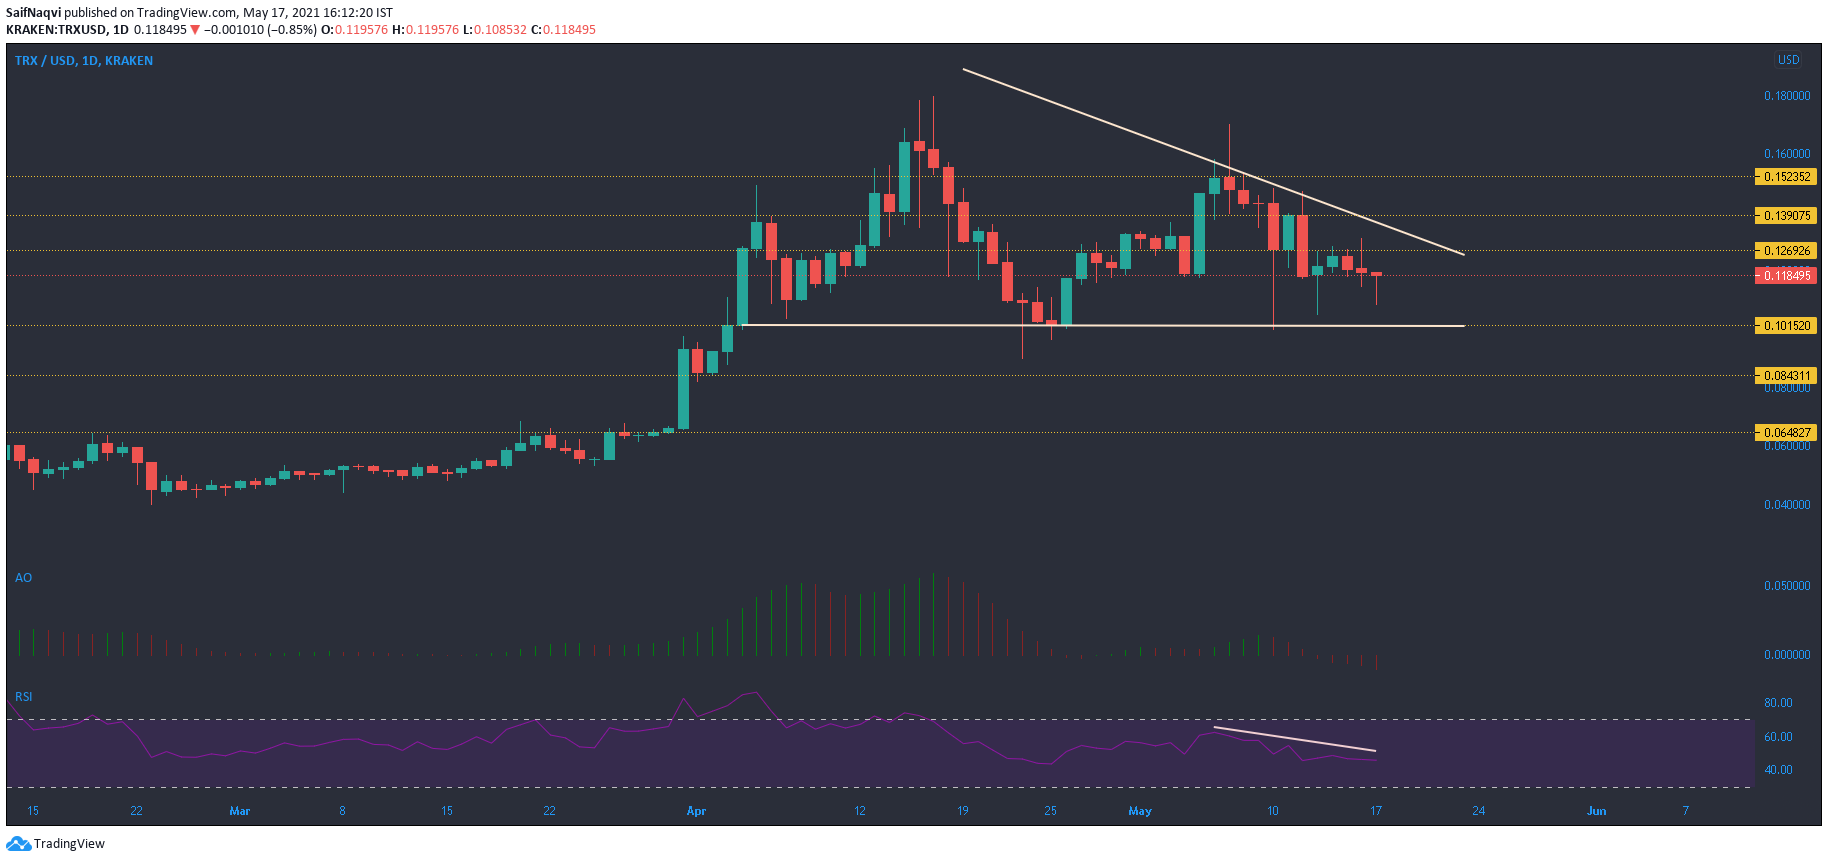
The formation of a descending triangle presented a dangerous path ahead for Tron. Conceding $0.101 support and the bottom trendline of this pattern to the sellers could lead to a 30% retracement towards $0.0648 support and the 200-SMA. Selling momentum was on the rise according to the Awesome Oscillator but a trade should not be initiated till a breakdown occurs. Lower highs on RSI indicated weakening and confirmed a downtrend for TRX.
If buyers return at $0.101 and push TRX above $0.139, this pattern would be invalidated. Moreover, a breakout from $0.15-resistance would indicate an incoming price swing.