Uniswap: Why UNI traders must watch THESE levels below $4.70
A weekly UNI trading session close below $4.70 would be a sign of trouble for swing traders and investors looking to buy the dip.



Uniswap [UNI] registered oversold readings on its RSI on Saturday, the 14th of November. Like the rest of the crypto market, UNI also witnessed sizeable selling pressure towards the end of the previous week.
Uniswap token sweeps weekly high liquidity before retracing
In a recent report, AMBCrypto warned that $5.80 was one to watch for swing traders and investors. The higher timeframe bias was bullish, but the correction has been steep.
Termed a healthy reset, the wave of selling and liquidations was enough to drive the altcoin’s price below the $5.0 psychological level, deeper than anticipated.
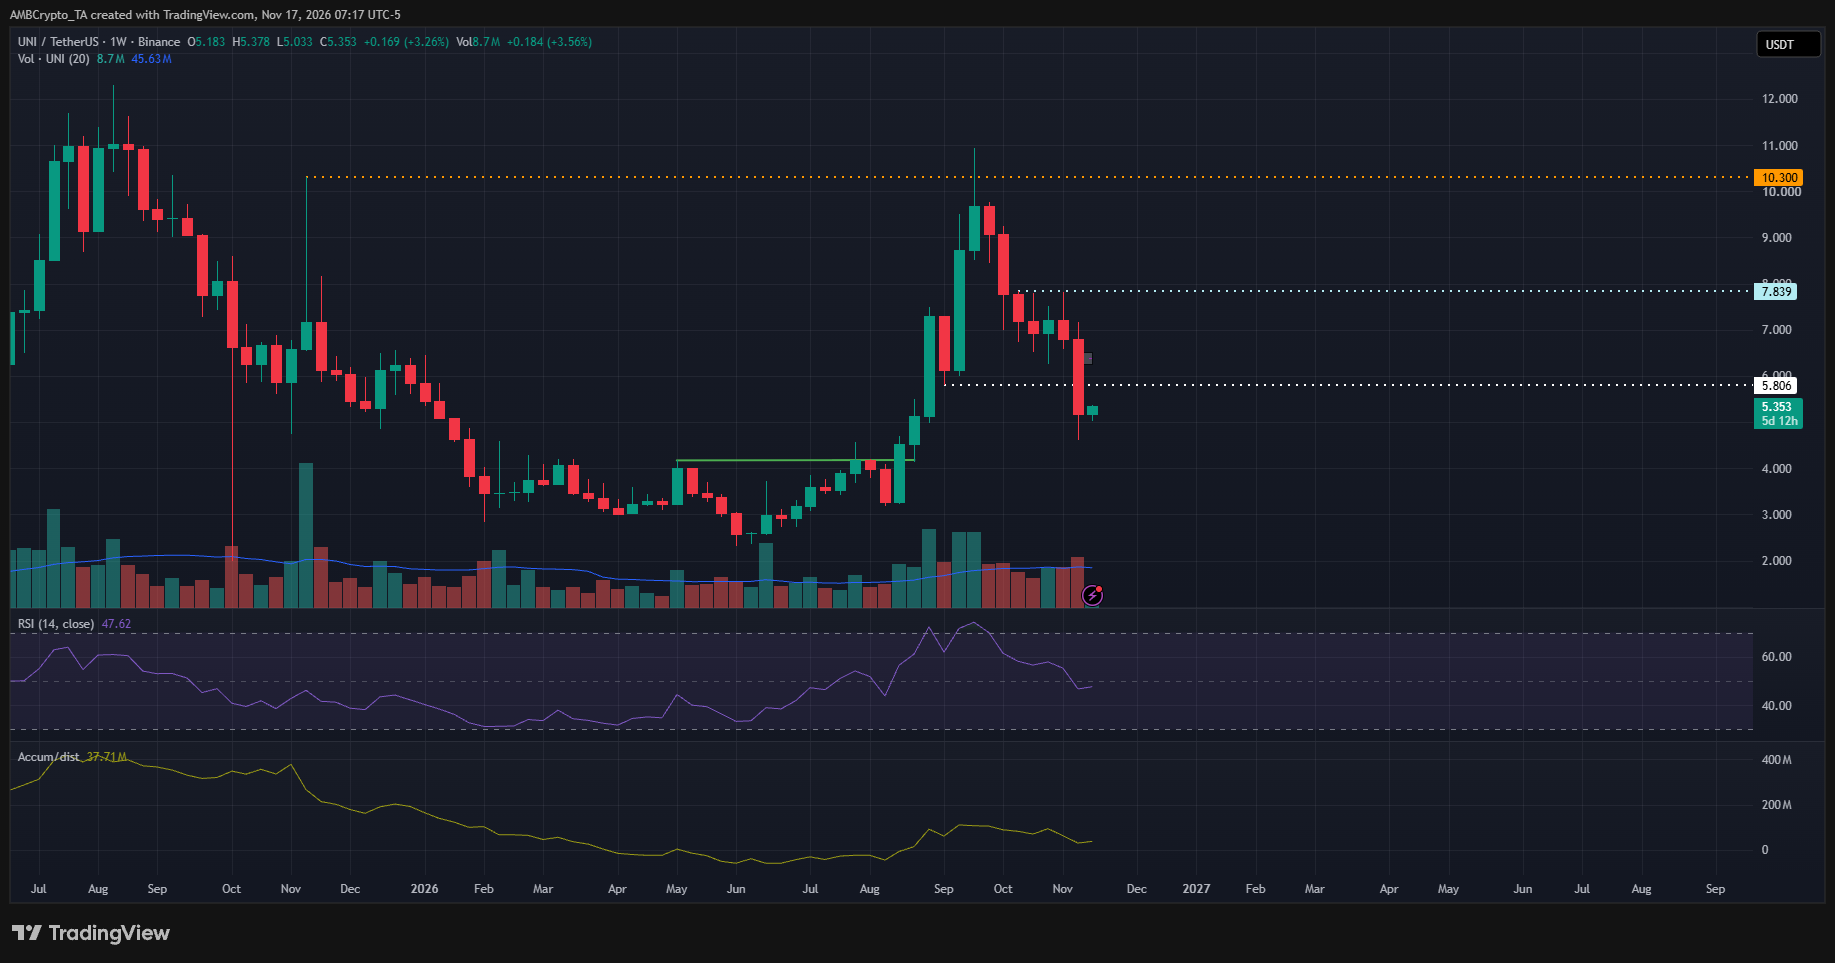
The weekly chart showed an attempted breakout past $10.3. The rejection proved this was a liquidity sweep before a correction. The loss of the $5.80 low, an important level on the daily chart, highlighted the short and medium-term bearish bias.
However, the weekly chart maintained an upbeat outlook. A weekly session close below $3.17 is needed to shift the long-term outlook bearish. An early warning sign of bearish dominance would be a weekly session close below $4.70.
The worrisome UNI signals on the lower timeframes
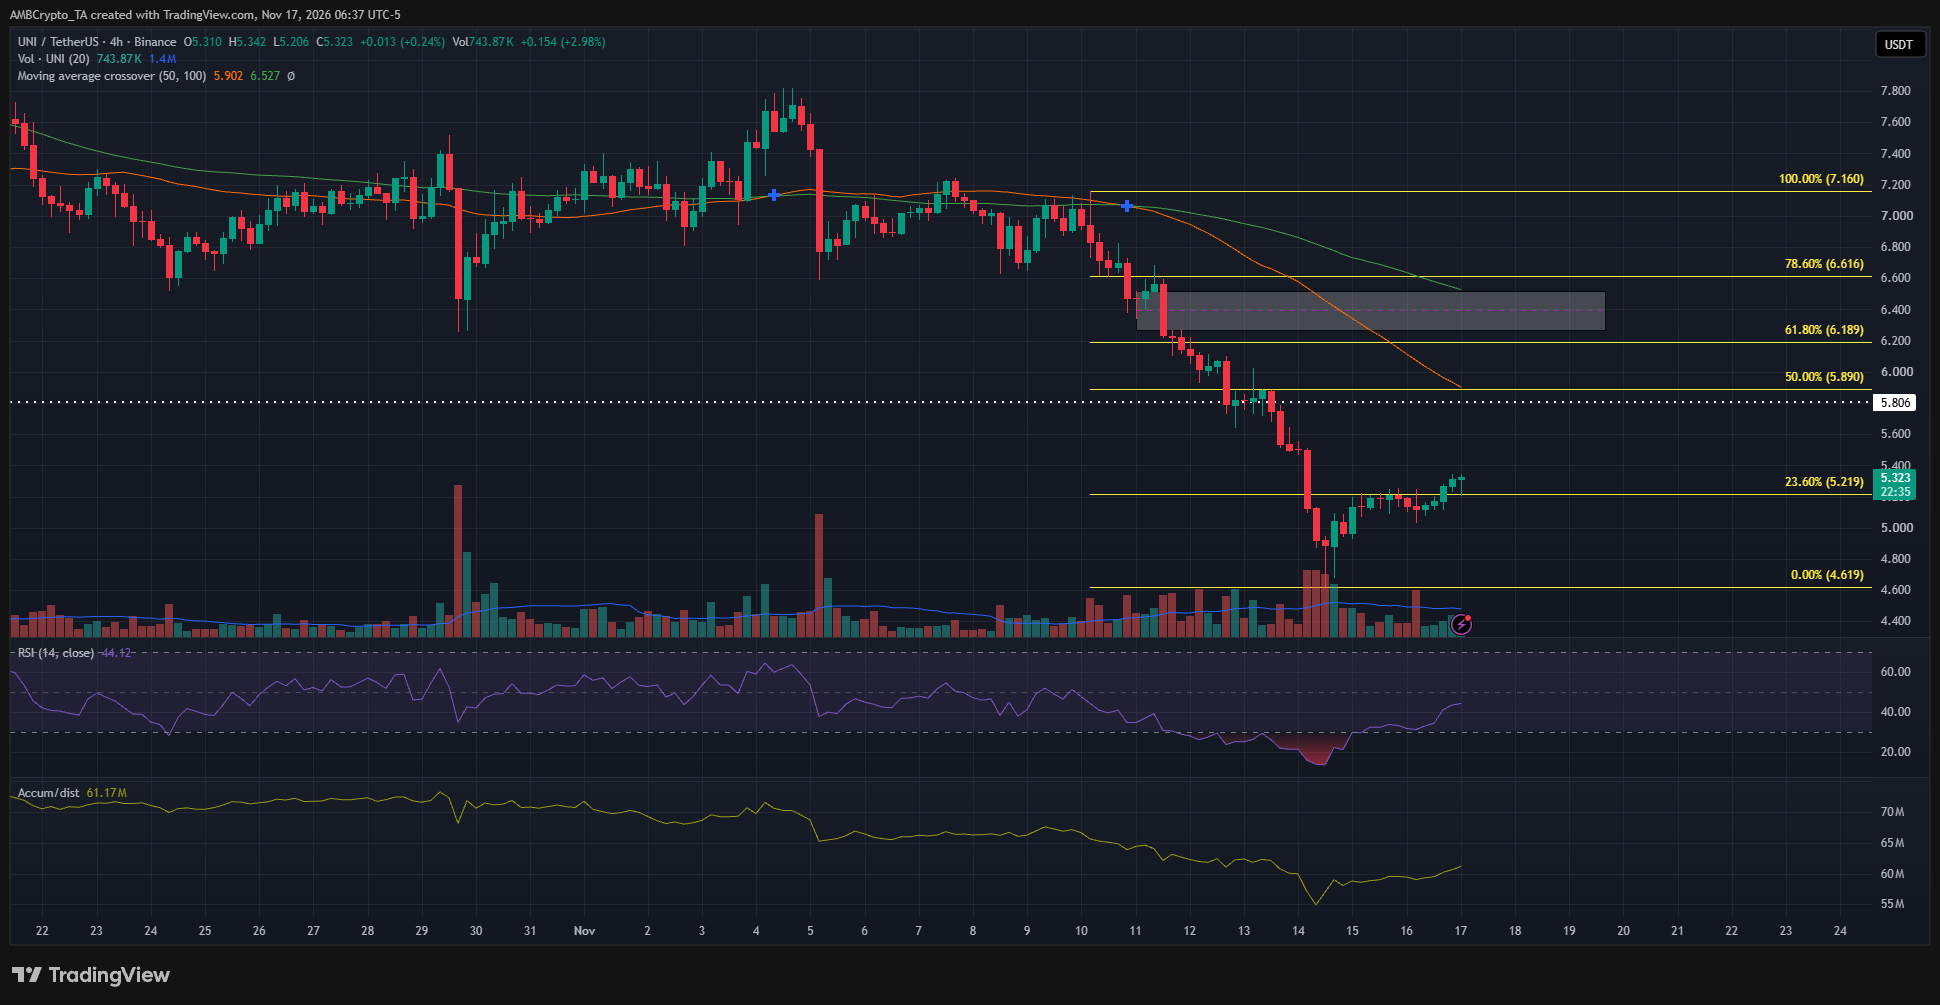
The 4-hour price structure was firmly bearish. A week ago, the altcoin was hovering above $6.40, trading within a range that extended to $7.80 since the second week of October.
The price drawdown since has continued the H4 bearish trend that began in October, and was merely paused within the aforementioned range-bound price action.
The A/D indicator has slowly been in decline in November. This decline accelerated over the past week to highlight increased selling volume. The RSI also dived into oversold territory below 30 on this timeframe.
The price was well below the moving averages, which had formed a bearish crossover and were following UNI prices lower.
Putting the factors together, the $5.89-$6.60 levels, which were key Fibonacci retracement levels and had confluence with the 50 and 100-period moving averages, were resistance levels that could see the downtrend continue after a retest.
Final Summary
- The Uniswap price action was firmly bearish in the short-term. A bounce toward $5.89-$6.61 would likely present a selling opportunity.
- A weekly UNI trading session close below $4.70 would be a sign of trouble for swing traders and investors looking to buy the dip.