Up by 16% in 2 days, LUNA traders need to know this

Disclaimer: The findings of this analysis are the sole opinions of the writer and should not be considered investment advice
LUNA has been on fire over the past couple of days as it rocketed from $48 to $57, at the time of writing, backed by steady demand. In fact, it has been one of the few large-cap altcoins to perform quite well after Bitcoin bounced from the $36.4k level.
In other news, the Terra blockchain infused $450 million worth of UST into the Anchor Yield reserve, extending reserves for the next 12 months.
LUNA- 1 hour chart
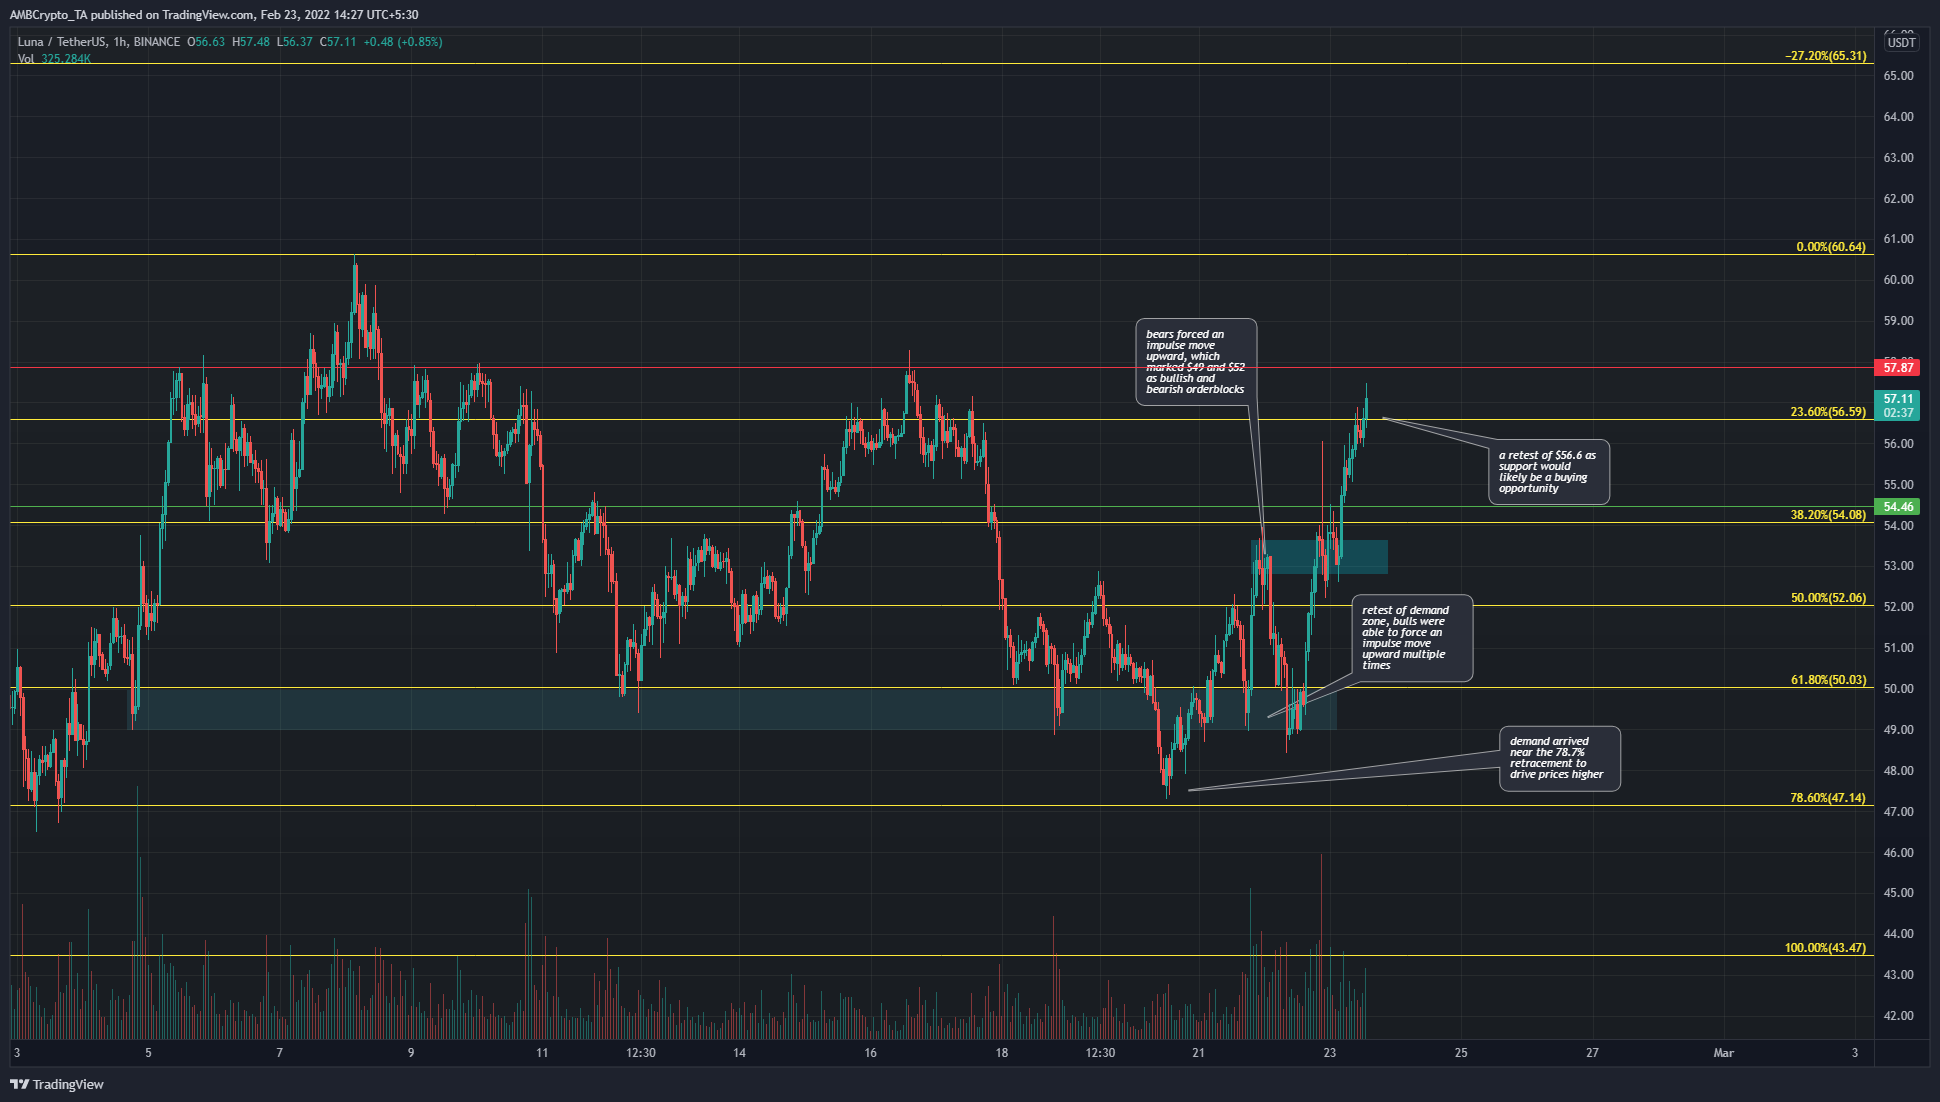
Based on LUNA’s move from $43.47 to $60.64 in early February, a set of Fibonacci retracement levels were plotted (yellow). In the past few days, the price slipped beneath the 61.8% retracement level at $50. The $49-$50 area (cyan) is a place where demand has stepped in.
However, shortly after slipping under $48, the bulls rallied and flipped this area back into an area of demand, forming a bullish order block in this area. This saw LUNA test this area and move higher, quickly, driven by demand.
The day prior to press time also saw the $53-area flipped from supply to demand and LUNA’s short-term market structure was bullish once more. The $57.87 resistance could be a place to take profits on long positions, at least partially.
A retest of the $56.6 and $54-support levels could be buying opportunities.
Rationale
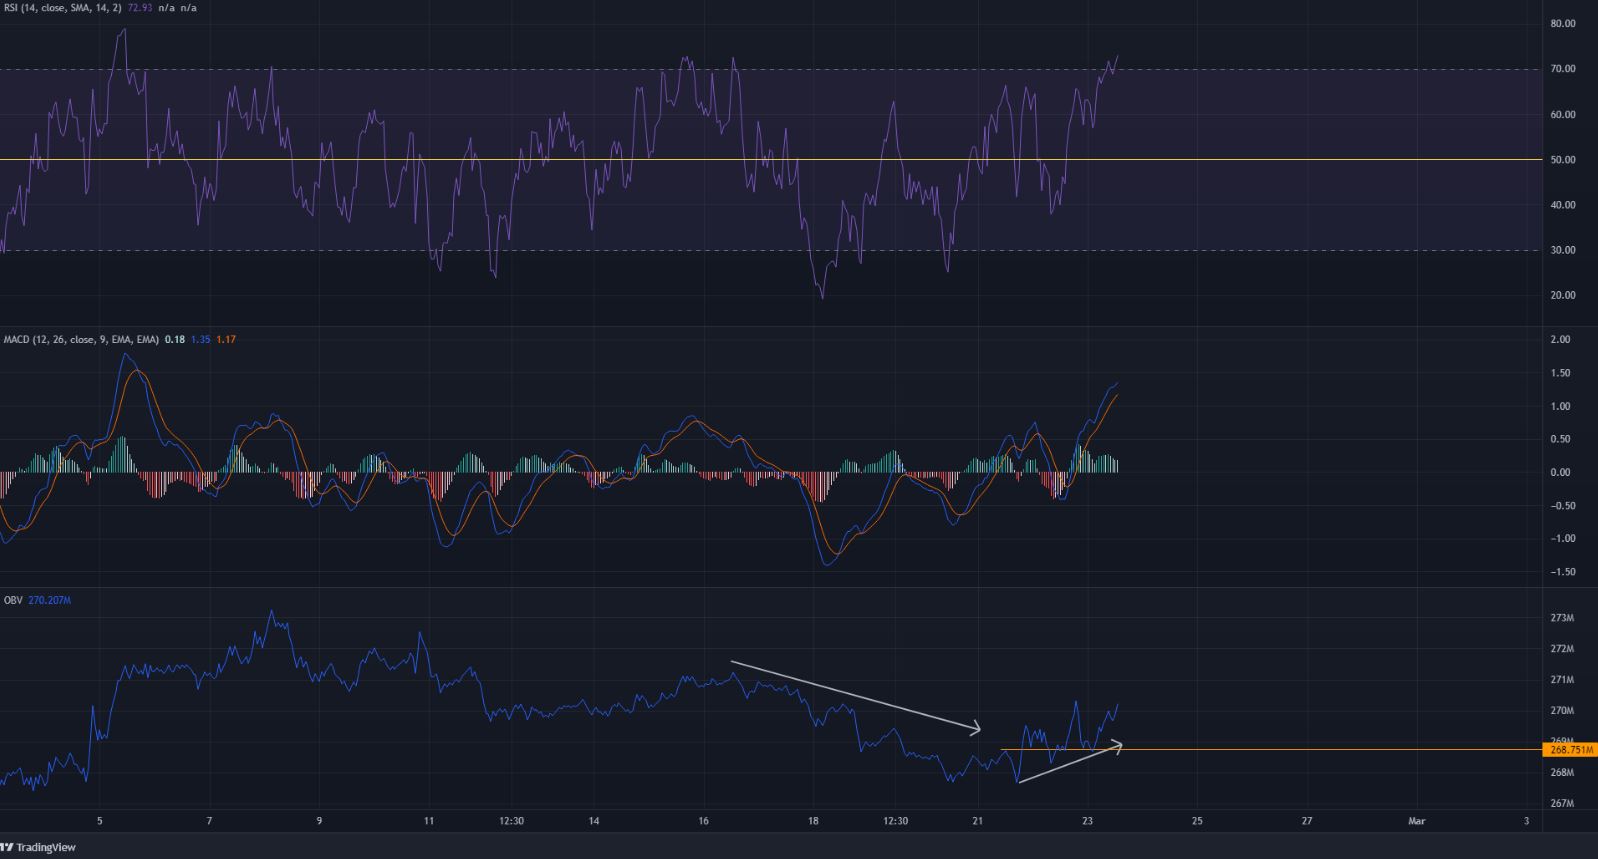
The RSI climbed above neutral 50. It was rejected at the 65-level on three occasions within just the past couple of days. However, at the time of writing, the RSI broke above and entered the overbought territory. This does not indicate an imminent pullback by itself but is only evidence of strong bullish momentum.
Similarly, the MACD also formed a bullish crossover and soared above the zero line to show upside momentum.
The OBV has also been climbing over the past couple of days. This showed there was legitimate demand behind LUNA’s move upward from the $48-area.
Conclusion
LUNA appeared to be strongly bullish on the charts in the near term and the $56.6 and $54.5-levels could be retested as support before the next leg north. The $57.87-level can be used to take partial profits.
If demand strengthens in the next few days, LUNA might not pull back as deep as the $54-level.