
Massive gains, new ATHs, and star performances over a fortnight. In the real world, this would be the true definition of success. In the crypto-market, however, such stardom is often short-lived and coins have disappeared into oblivion while trying to battle the larger market.
One such success story is the utility token for the Quant network – QNT. It has seen gains of more than 175% in just a fortnight. On 20 July, when the larger market rally began on the back of Bitcoin, QNT was trading at $66. In the next 14 days, however, QNT rallied up to $181.56. It hit its all-time high on 4 August.
What’s more, the altcoin’s listing on Binance also contributed to the rally, as has been the case for a lot of other alts.
Higher ROI than BTC, ETH, and most alts?
At press time, Quant’s yearly ROI stood at +2220.74% (ten times higher than Bitcoin), while its monthly ROI v. USD was +117.65%. On the contrary, the ROIs for Ethereum and Cardano were +12.61% and -4.38%, respectively.
While it is arguable that altcoins generally have a higher ROI than Bitcoin, sometimes these could be Bitcoin-backed rallies or just simple pumps and dumps. Interestingly, however, in the case of Quant, its price has been hiking constantly since 20 July.
In fact, this QNT rally has been backed by high trade volume bars and a strengthened Relative Strength Index (RSI) too.
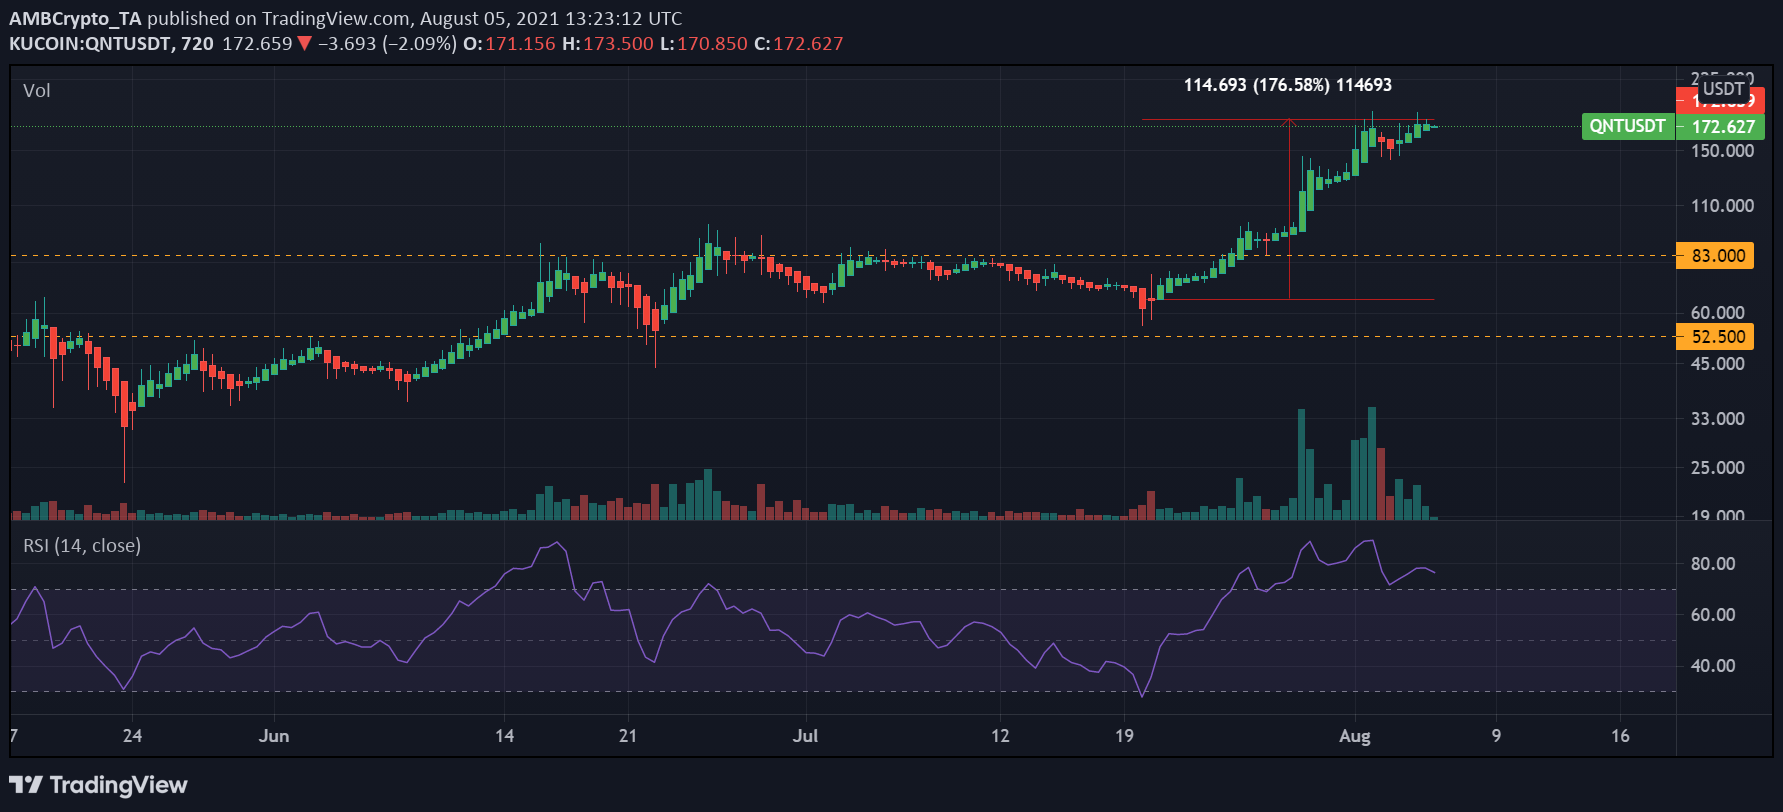
Source: TradingView
Even though the rally looks legit, it is also notable that it took place in a bullish market on the back of massive Bitcoin gains. What’s more, while almost all of the market’s alts took off during this time, none of them made it to their ATHs.
Now, with both BTC and ETH’s prices falling and their bullish momentum getting exhausted, the question arises. Will Quant be able to sustain its top or give in to the general market trend?
Here’s what the metrics say
On 29 July, Quant saw its highest traded volume since it started trading in 2018. However, according to a recent Santiment report, soon after, twice the price was seen going up on lower volume days which highlighted that there might be some weakness in demand.
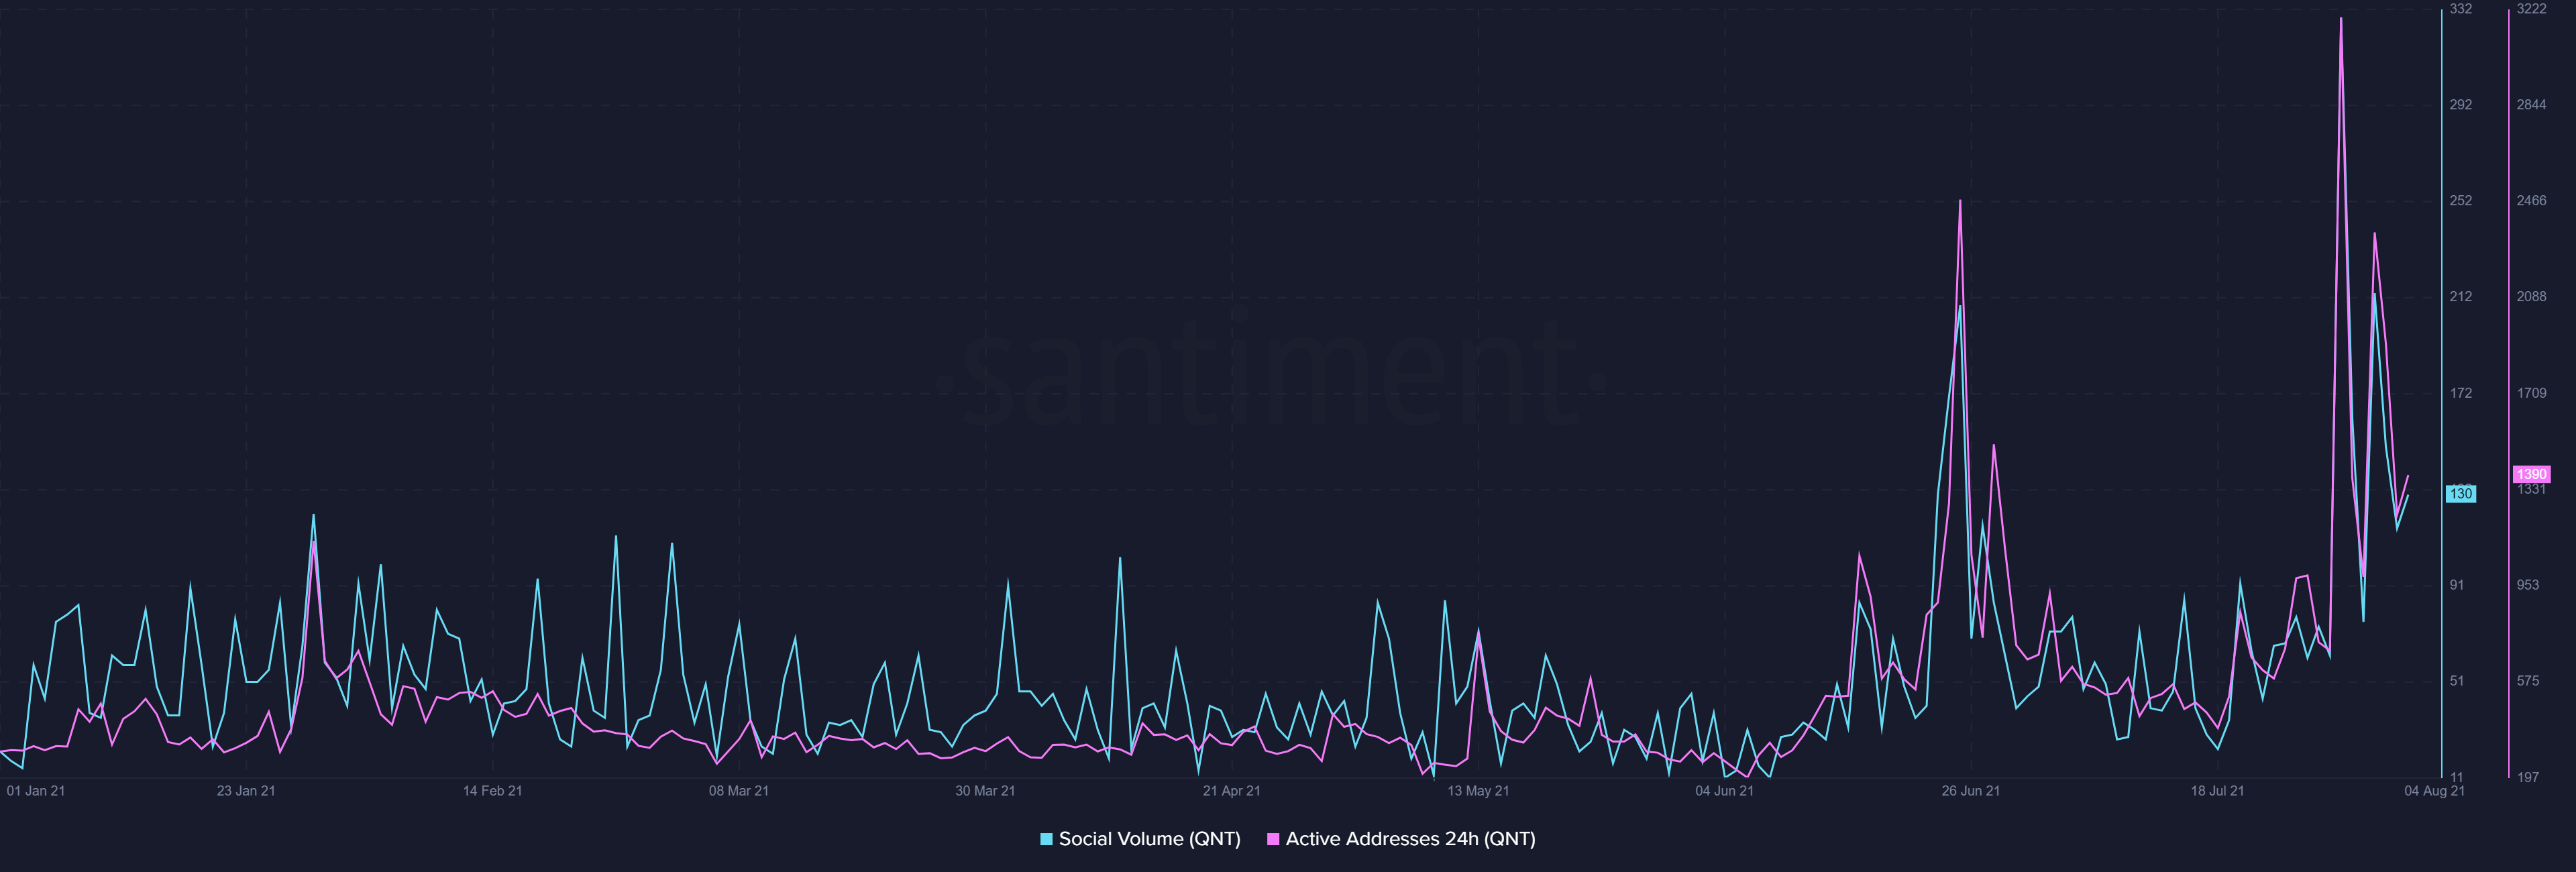
Source: Sanbase
Additionally, a drop in active addresses (24hr) even as the price continued its upward movement suggested that weakness was starting to show since fewer participants were coming in. Social volumes too had peaked along with active addresses (24 hours) on the daily chart. Notably, both the metrics saw a peak on 29 July and a smaller peak on 1 August. However, both have been dropping since.
A drop in QNT social volumes highlighted that as the excitement started to wane, active addresses dropped too.
Further, while QNT’s MVRV (30day) recorded a peak on 1 August, it was still in the danger zone as short-term participants seemed to be well in profit and highly incentivized to take it.
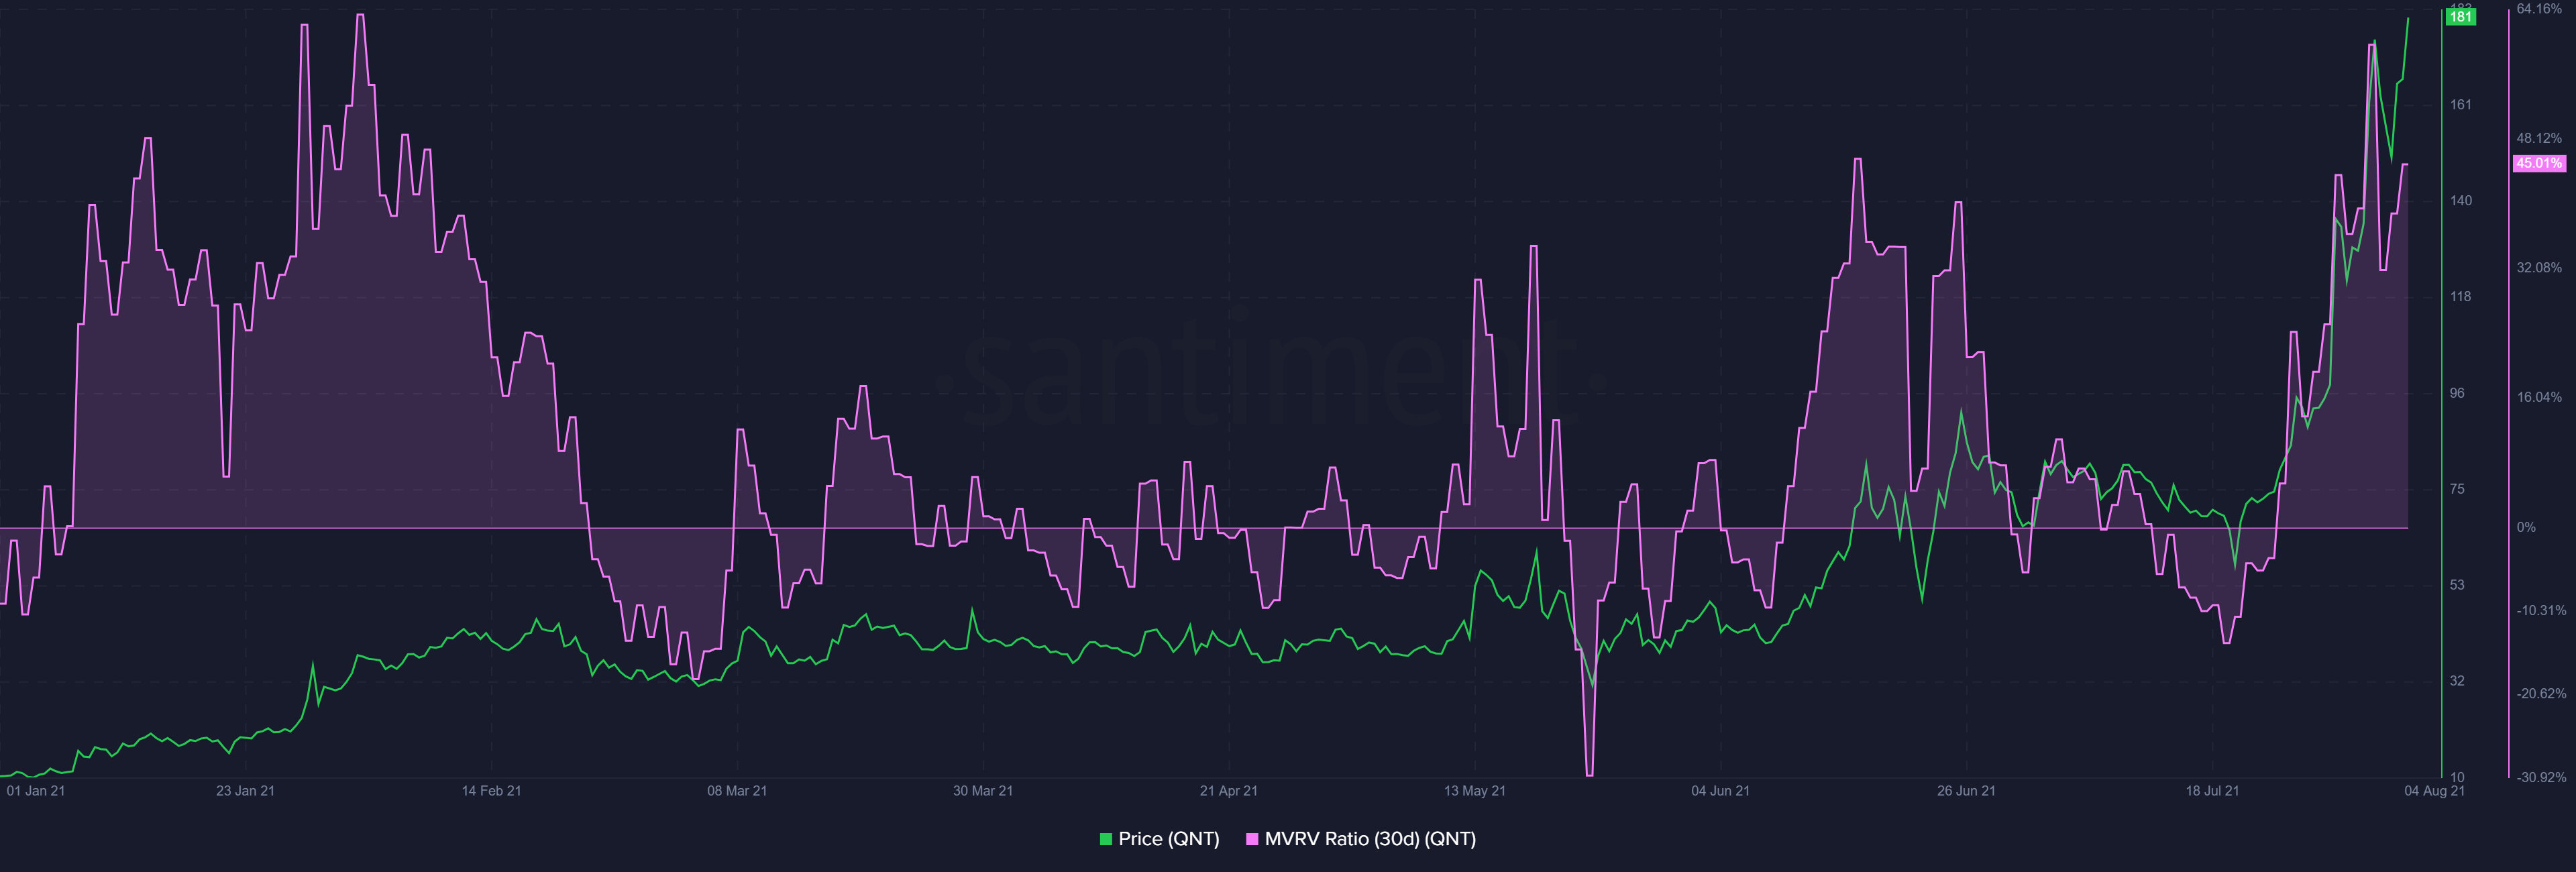
Source: Santiment
Looking at the metrics, it does seem like Quant is at crossroads as the larger bullish rally is getting exhausted. However, Quant’s price has held up pretty well, even as Bitcoin itself fell recently. It will be a matter of days before we know whether QNT can sustain its price or not.