Chainlink, WAVES. Verge Price Analysis: 06 August

Despite Bitcoin noting a 5.2% jump on its daily chart, altcoins such as LINK and WAVES saw flat price action. LINK recorded no major price changes and in fact, pictured a slightly bearish outlook. WAVES, more or less, looked likely to mirror the same.
On the contrary, Verge moved up by 4% and flashed signs of a further increase in value.
Chainlink [LINK]
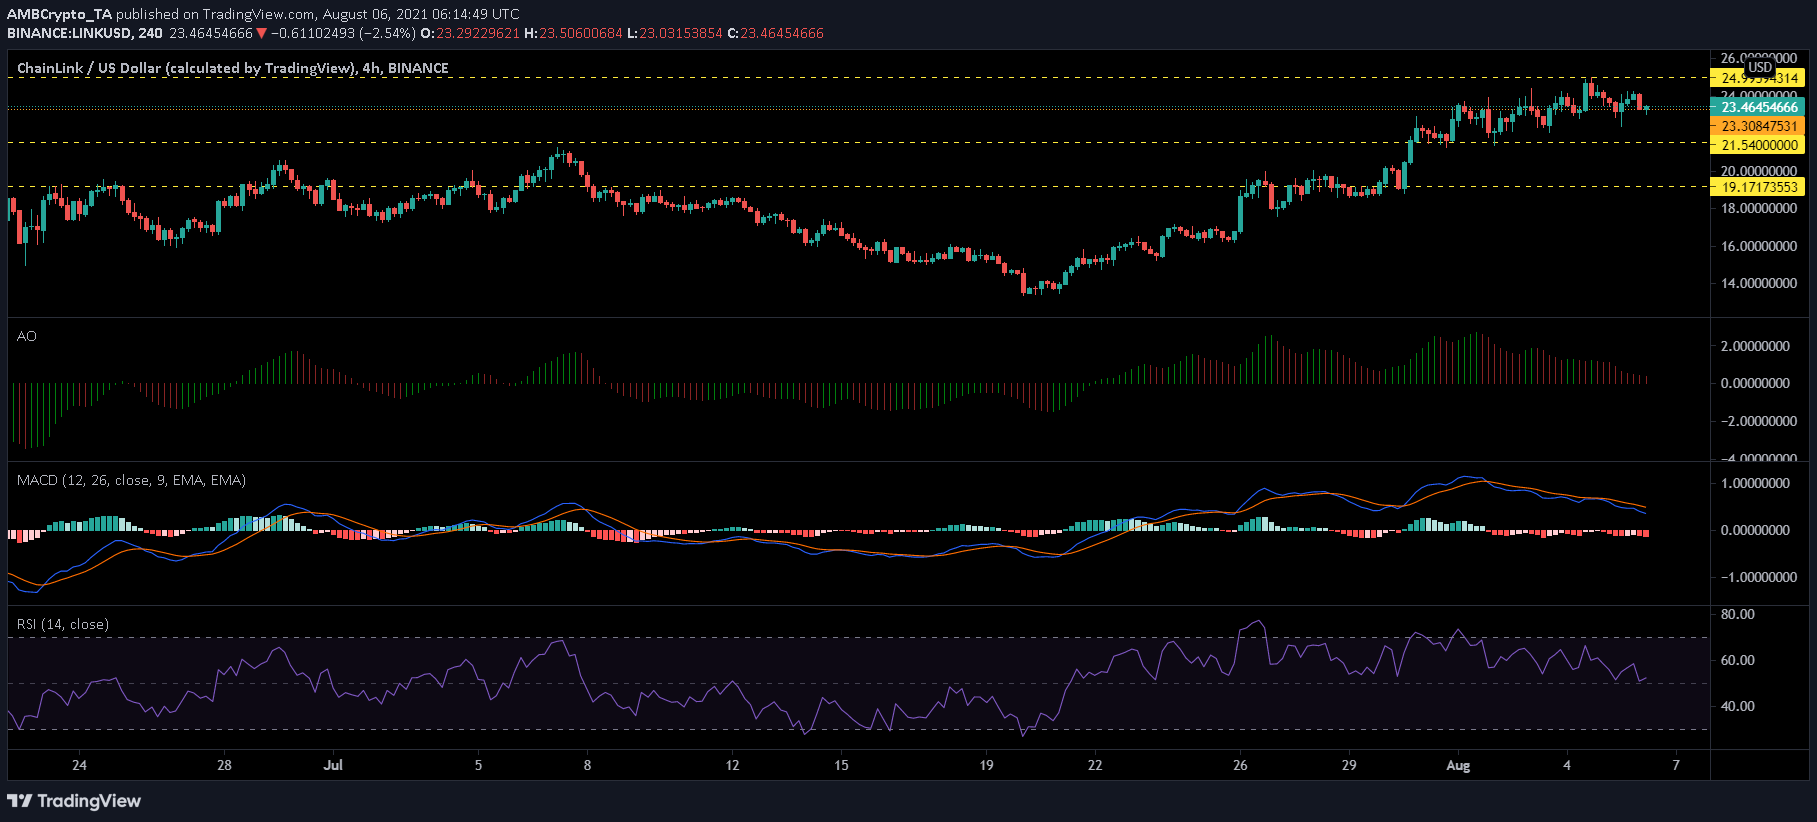
Chainlink was priced at $23.46 at press time. LINK rejected its resistance of $24.99 for the second time in the last couple of days. For LINK’s press time price level, the local support level was $23.30. If the price continues to oscillate around this level for a few more sessions, a dip might push it down to $21.54.
Technical indicators pictured bearish pressure in LINK’s market as red signal bars were seen mounting on the Awesome Oscillator. Additionally, the MACD also flashed red histograms.
The Relative Strength Index, however, registered a gentle uptick and implied some buying pressure.
WAVES
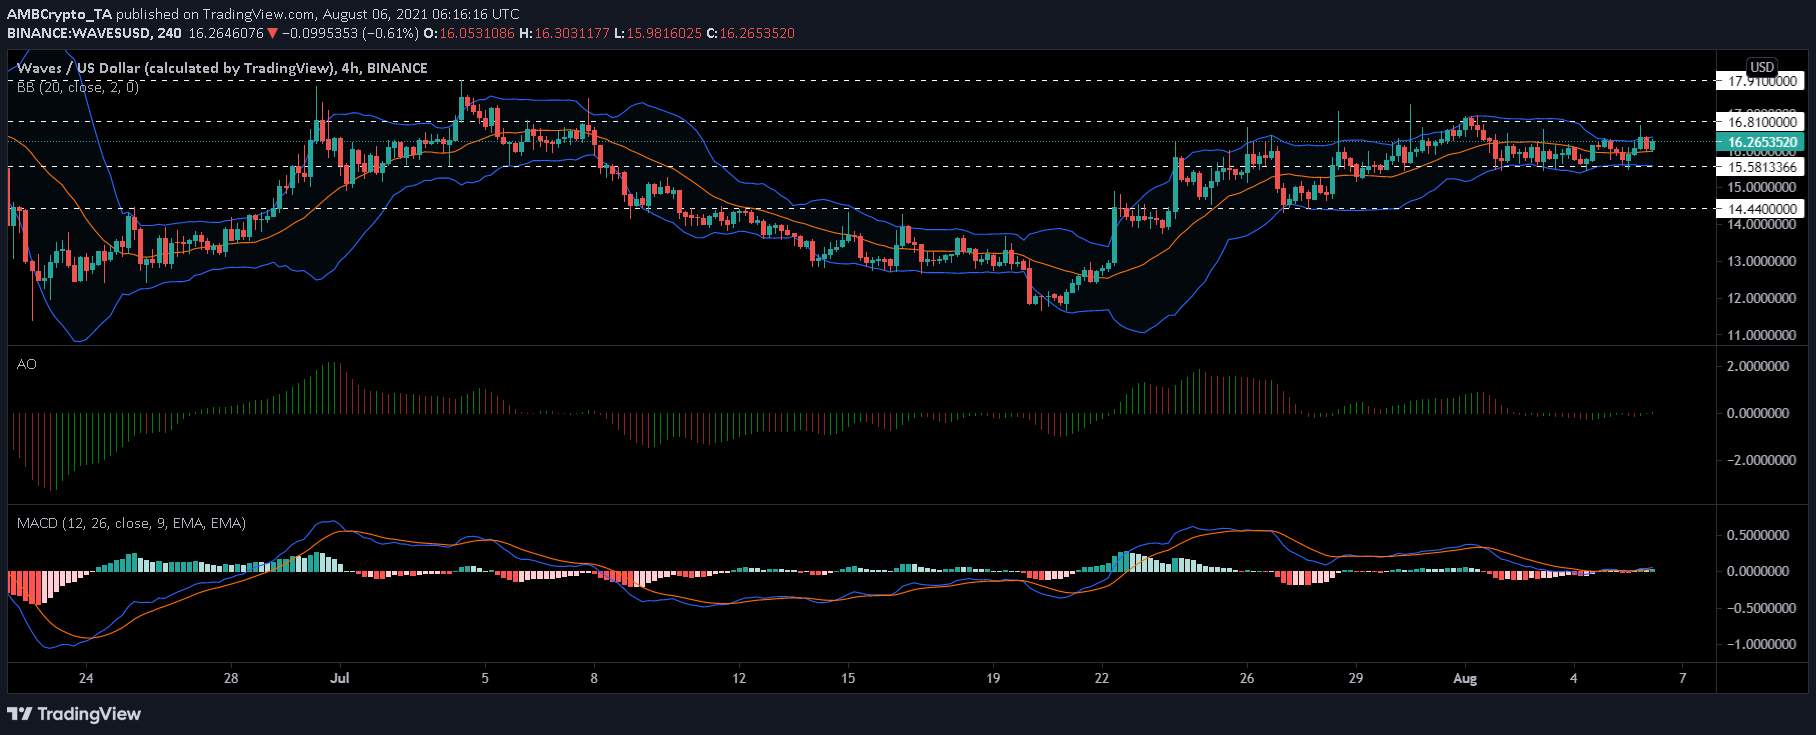
Although the altcoin recorded a hike of 1.8%, the token saw a lot of consolidation when sandwiched between $16.26 and $15.58. In case WAVES breaks away from its lateral movement, the immediate resistance would lie at $16.81. However, a fall in the crypto’s price would make the crypto-asset settle on the $15.58 support level.
WAVES flashed mixed signals as the technical indicators gave no clear indication of the altcoin’s direction. For instance, the Awesome Oscillator pictured both red and green signals intermittently, followed by the MACD which faintly noted the onset of green histograms.
The Bollinger Bands remained narrow and restrained price movement within the price band.
Verge [XVG]
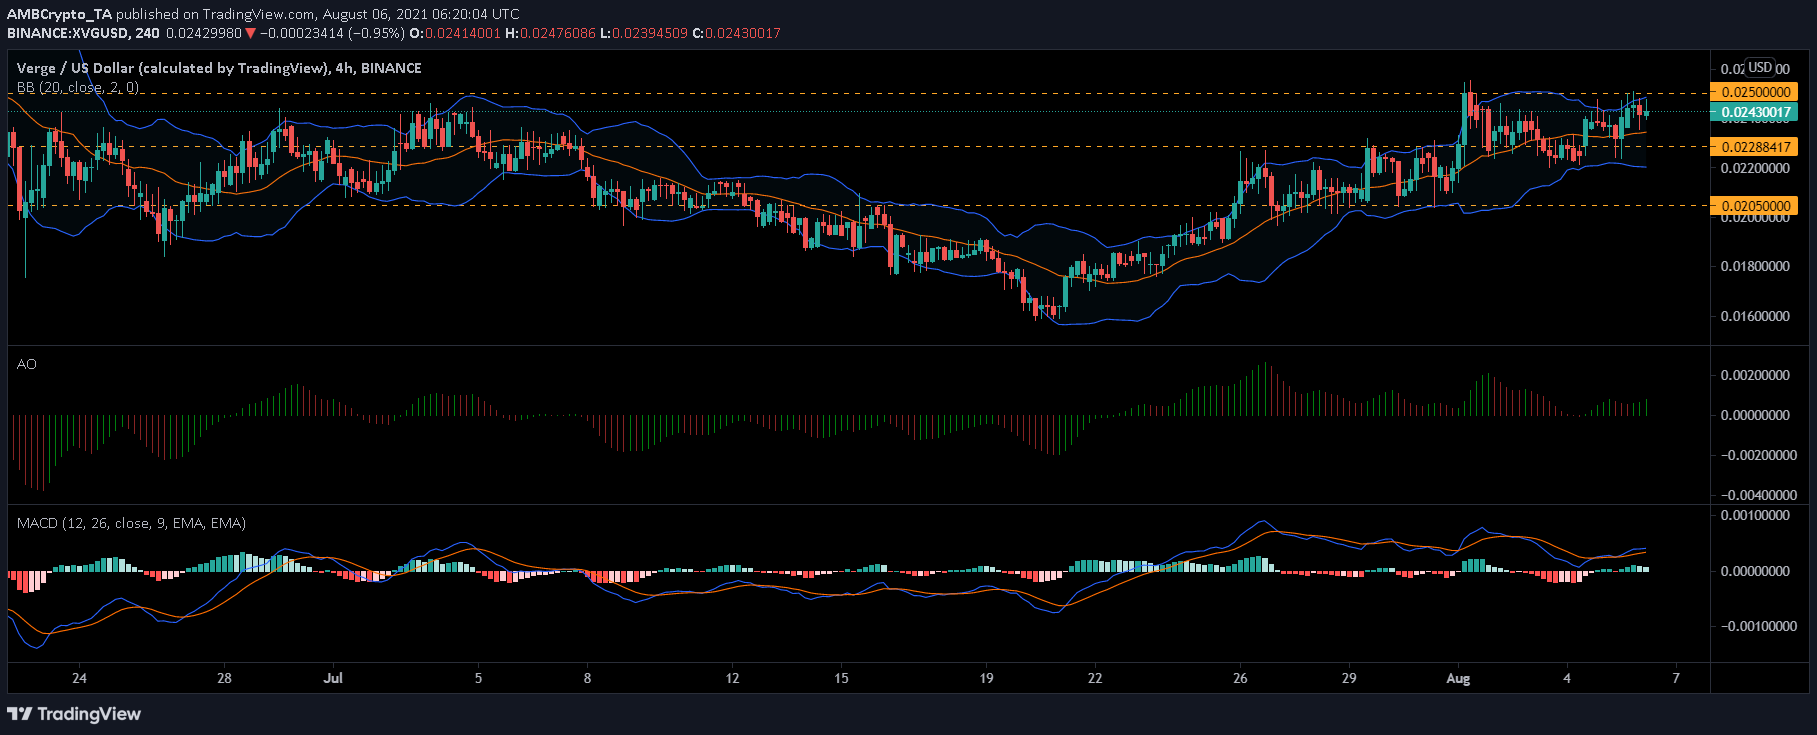
XVG registered a 4% hike over the last 24 hours. However, it did not manage to move past its resistance level of $0.025 on its second attempt. The local support of XVG was at $0.022, but the alt traded well away from that level and was unlikely to dip considering the presence of buyers in the market.
Bullish sentiment prevailed in the market as the indicators were seen in the green, at press time. The Awesome Oscillator noted a rise in green signal bars and the MACD correspondingly pictured a bullish crossover.
Finally, the Bollinger Bands made way for incoming volatility as the indicator opened up on the charts.