What better defines the current Bitcoin market: bears or ‘buy the dip’

An unpleasant calm seems to have taken over the Bitcoin market as the king coin oscillated at $46,451 presenting a range-bound movement for over a week now. BTC’s recent under-performance has given way to the fall of Bitcoin dominance to as low as 39.46%, a level last seen three years ago in 2018.
That said, the unusually mellow trading days and consolidation since the festive season has led the market’s sentiment to tip more towards the bearish side. The reduced market volatility has pulled BTC’s price by almost 5% to as low as $45,722 on January 5.
So, with BTC near $45K yet again is this an ideal ‘buy the dip’ time or the start of a bear market?
High Leverage
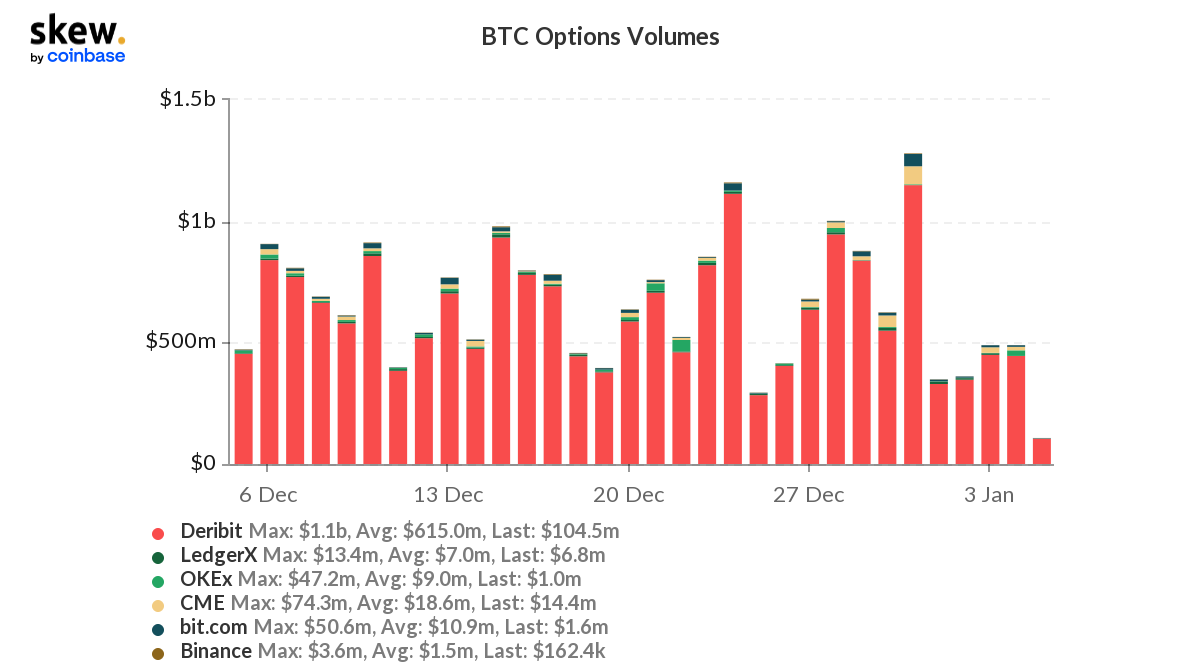
The December options expiry saw the third-largest relative decline in open interest of close to $5.85 billion in the BTC options market history as 47.8% of OI expired. The Futures and Options have been more or less quiet with low trading volume as the top asset’s spot price has been consolidating.
However with a new year euphoria in place anticipation around a major comeback for BTC has been forming.
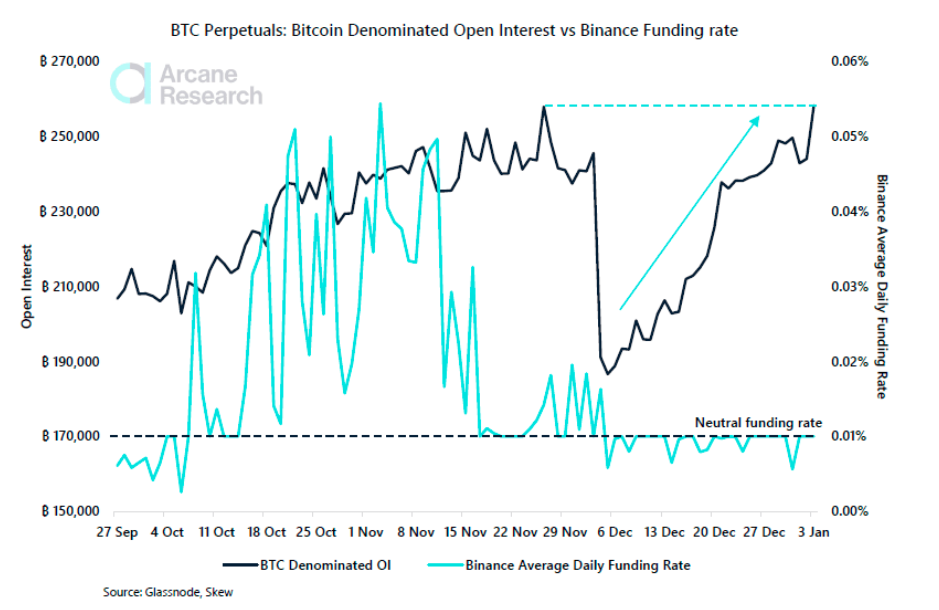
Notably, with OI back at the levels it last hit in the third week of November when BTC’s price was near all-time high levels of $69,000, there were expectations of institutional traders showing signs of renewed interest.
One thing however still needed a push which was the funding rate. Unlike in November, funding rates right now were mostly neutral making the market more volatile.
With the BTC perpetuals OI surpassing November highs and the funding rate looking neutral the market’s traders seem to be back to leverage. Further, with volatility high and prices consolidating, the market looked heated and a short squeeze scenario could be in play. However, longs could be shattered if BTC’s price takes a fall under the crucial $45K-$44K level.
Bear market or buy the dip?
At the time of writing, Bitcoin was seeing a declining price momentum towards the $44K-$45Ksupport zone which was being tested yet again. Alongside that, the BTC short-term holder MVRV indicator had decreased below one. The last time a similar trend was seen was back in May when the mini-bear market period started.
For the Short-Term Holder cohort, the aforementioned metric shows the magnitude of current underwater pain relative to past bearish periods. The bearish periods in 2018, 2019, and mid-2021 all saw STHs persistently underwater, with STH-MVRV values of 1 acting as resistance.
Data from Glassnode presented how the psychological $51.4K level would be a key level to watch representing new buyers ‘getting their money back.’ That said, the TUSD reserve tells us that right now the buying the dip sentiment is taking over the selling sentiment.
So seems like while the larger on-chain undertone was bullish and the derivates markets were highly leveraged it made BTC ripe for a move but in which direction the same could pan out is still a matter of doubt.


