What Bitcoin’s ‘neutral’ July-end approach will mean for BTC in August

Bitcoin, the world’s largest cryptocurrency, recorded a significant sell-off between June-July 2022. This, understandably, sent its price tumbling down the charts. In fact, BTC saw its price fall below the $20k-mark, with many holders exiting the network in fear of aggravated losses.
However, a new month could see a new beginning for the crypto. So, what exactly is in store for Bitcoin in August?
Level up
Despite the obvious correction, Bitcoin did bounce back strongly in the latter half of July. At press time, BTC was trading above the $23.7k-mark with a 0.5% hike in 24 hours. In fact, the average amount of BTC circulated in July ended on a neutral note after breaking a 4-month price decline streak.
On-chain analytics platform Santiment used its NVT model to highlight this scenario in the graph below –
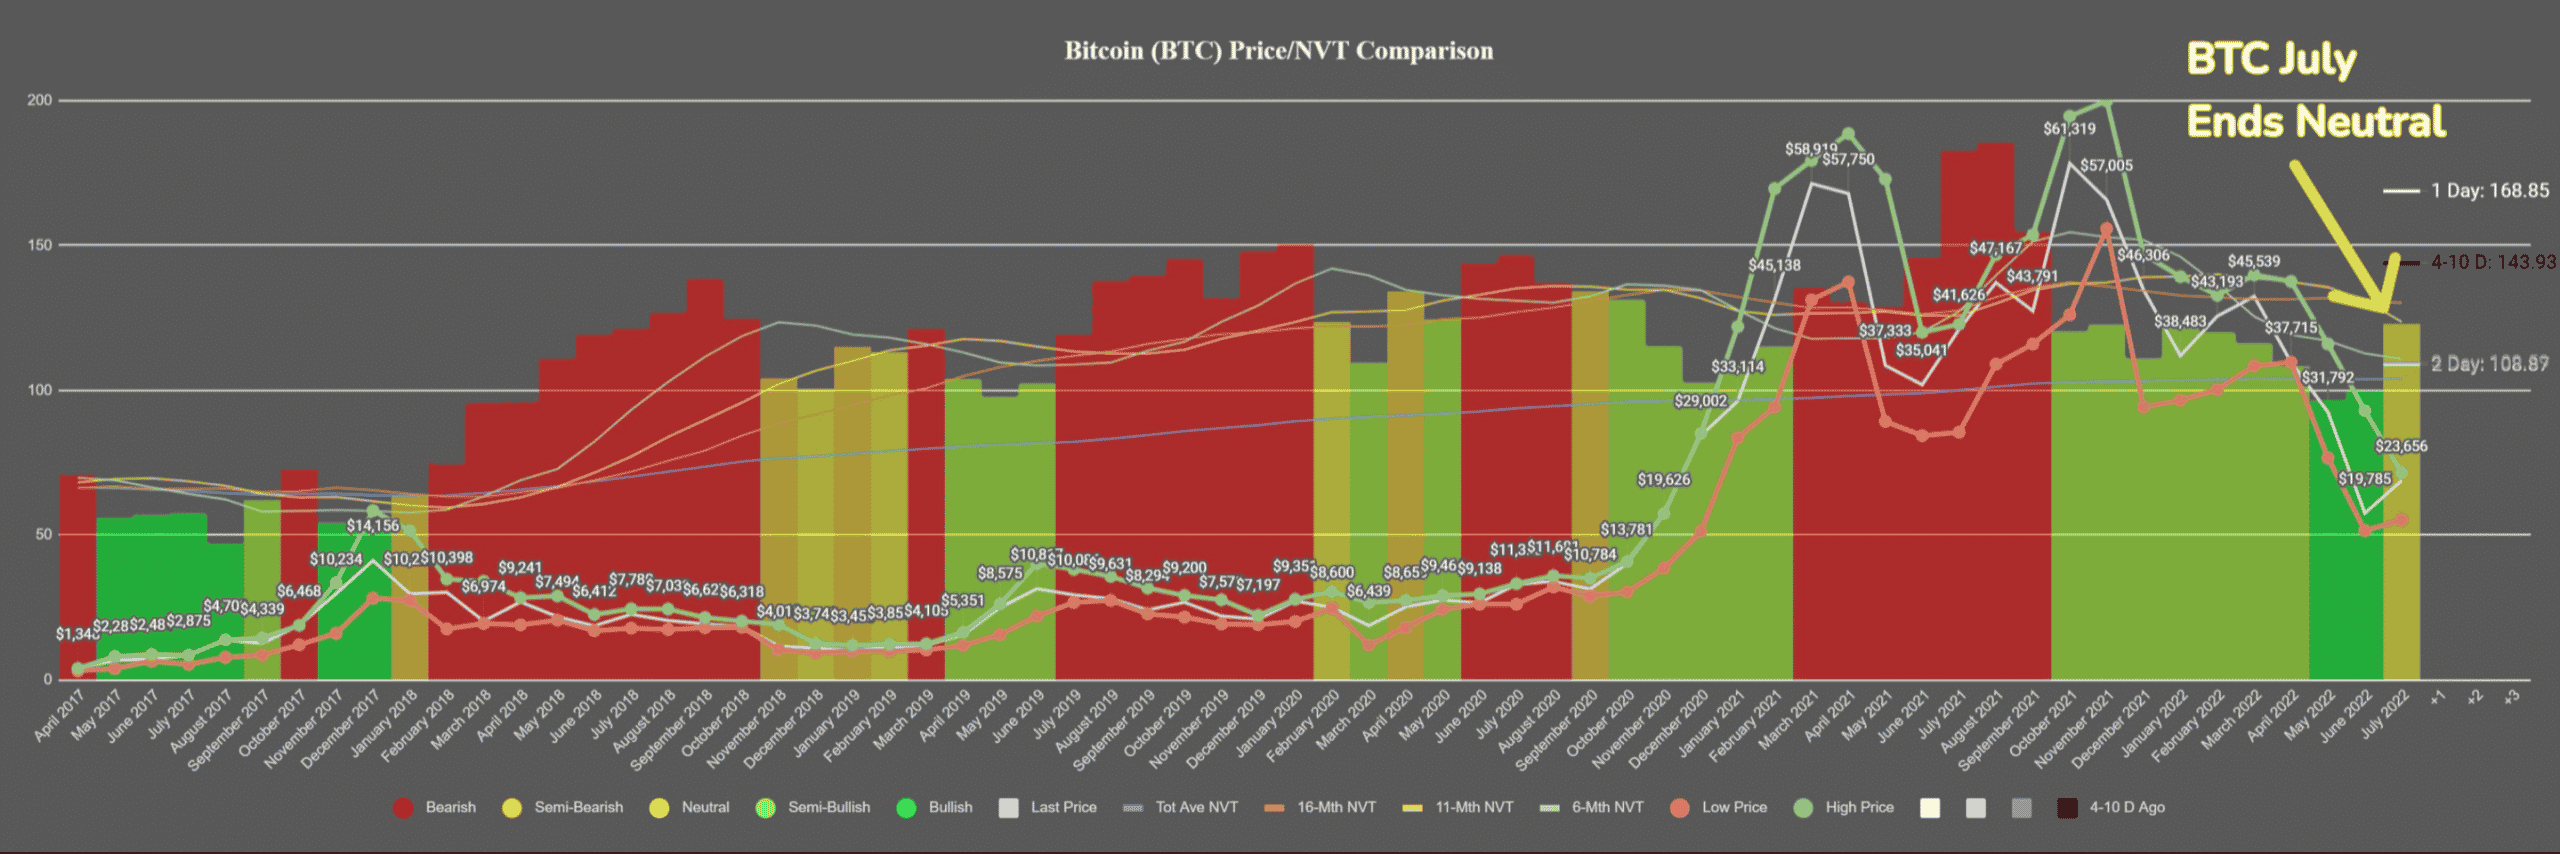
(NVT stands for Network Value to Transactions Ratio. Using this, one can see if a blockchain network is undervalued or not. When undervalued, the signal is bullish for the price. When overvalued, the signal is bearish.)
Herein, BTC jumped by +18% in July after the NVT model’s growing bullish divergence in May and June finally saw a price bounce. Santiment added,
“With a neutral signal now as prices have risen and token circulation has declined slightly, August can move either direction.”
On the other hand, despite this ‘neutral’ conclusion, holders did maintain an undeterred approach towards the flagship coin. For instance, the number of addresses holding Bitcoin highlighted an un-biased relationship.

Are we (break) even?
The short-term holders known as “weak hands” displayed a somewhat bearish scenario. As pointed out by an analyst in a CryptoQuant post (@the selling pressure from short-term holders might see a hike if their SOPR surges. (SOPR= Spent Output Profit Ratio)
That’s exactly the case here.
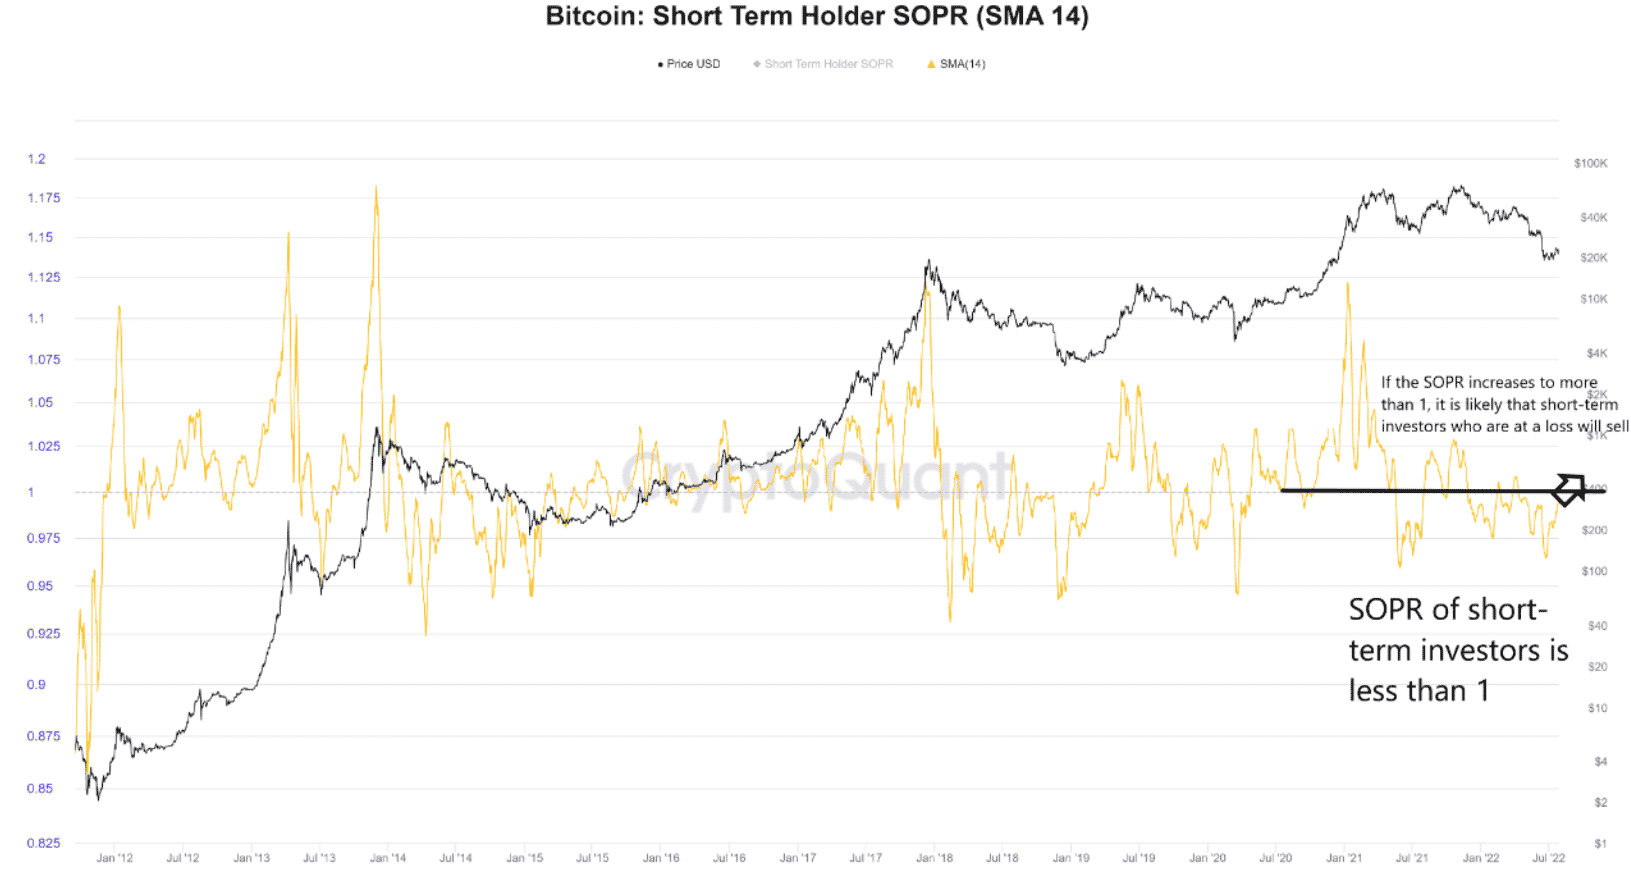
The aforementioned metric saw a significant rise in recent days, as seen in the graph mentioned above. The Bitcoin STH SOPR sunk down below “1” a few months back, suggesting that these holders were selling at a loss.
However, now that the SOPR approached the “SOPR = 1” line representing the “breakeven” point, one could expect more selling pressure. As the metric hits this level, investors who faced a loss “think they have now got their money back” and thus “sell their coins here.”
This would lead to a higher than usual selling pressure from the STHs at this mark. By extension, providing resistance to the price of Bitcoin. BTC might see some downtrend this time going into August, unless the long-term holders balance this move.
Whatever the case may be, some enthusiasts still believe that BTC remains far from a new bull cycle. For instance, prominent crypto-analyst TAnalyst recently tweeted,
#BITCOIN IS READY FOR A MASSIVE BULL RUN. pic.twitter.com/BZLIi3eiKv
— AO (@AO_btc_analyst) July 31, 2022


