What differentiates Chainlink from other altcoins in the current cycle?

Chainlink, at the time of writing, was trading at $27.56, down from the $35-level seen towards the end of February 2021. However, it remains an exciting time for Chainlink. In fact, it may even be an accumulation phase for Chainlink, especially since its correlation with Bitcoin was observed to be over 71%, based on data from Cryptowatch.
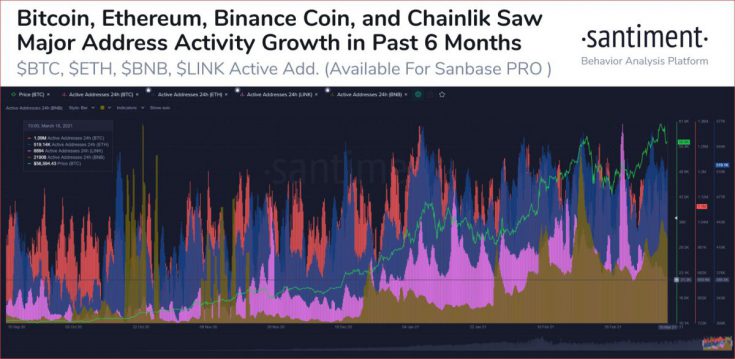
Based on historical data, during extended Bitcoin bull runs, top altcoins like Bitcoin, Ethereum, and Binance Coin have all registered gains in the number of active addresses on their networks. The same was true for Chainlink, with recent data from Santiment underlining the rise in Chainlink’s active addresses.
Though there is anticipation that Chainlink’s price will hike exponentially in the long-term, especially as the altcoin enters the NFT market with dynamic NFTs, an immediate rise in price can only be expected from its correlation with Bitcoin.
The recent drop of nearly 10% in Bitcoin’s price, from its ATH of $61,683, did lead to a corresponding drop in Chainlink’s price. However, soon after, both assets gained on the charts, with LINK appreciating too thanks to its correlation with BTC and the latter’s slow but consistent recovery on the price charts.
Besides, alongside Litecoin and Polkadot, Chainlink has led the altcoin rally several times in the current market cycle. Consider this – Chainlink’s oracle network today supports a growing number of DeFi apps, with the same key to the asset’s price gain of 14.9% since 23 February. While yes, the price was down by over 11% on a weekly basis at press time, this could prove to be a buying opportunity for retail traders below $30.
What differentiates Chainlink from other altcoins in the current cycle is its fast-paced integrations, often 10 in a week, and its World Bank-cited credentials in a recent research paper. In light of the expectations associated with LINK’s long-term growth, the press time price range may just be the accumulation level for interested investors.
Further, historically, Chainlink’s volatility percentiles have proven to be an interesting indicator of accumulation phases, with percentiles above 70% indicating distribution phases where the price has gained rapidly. This has usually been followed by a correction and a cycle restart. The current volatility percentile represents the accumulation phase for Chainlink, before a breakthrough in price.
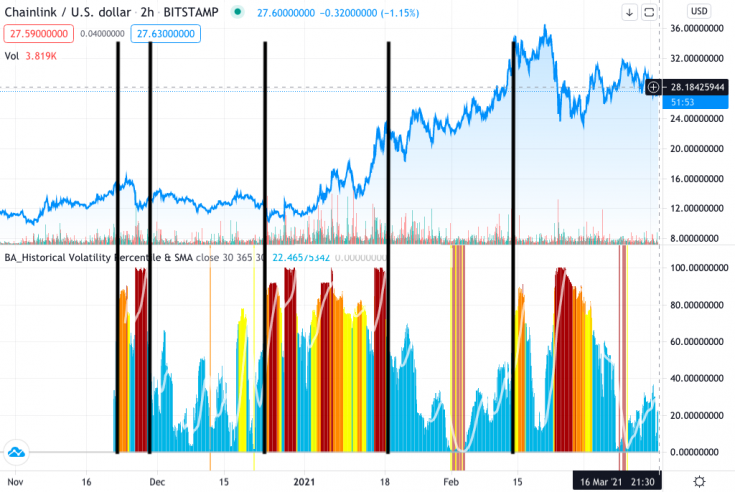
Based on the attached chart from TradingView, the crypto-asset is currently in the accumulation phase. Ergo, in the short-term, the price can be expected to hit its end of February 2021-level, before a correction based on the historical volatility percentile takes place.