EOS, Synthetix, SUSHI Price Analysis: 16 March

EOS attempted to regain the 38.2% Fibonacci level, but might need to negotiate some selling pressure to maintain the aforementioned level. SNX moved back within its descending triangle after a retest of its lower trendline. Finally, SUSHI cut its losses around the $19.18-support, an area that clashed with the 50-SMA.
EOS
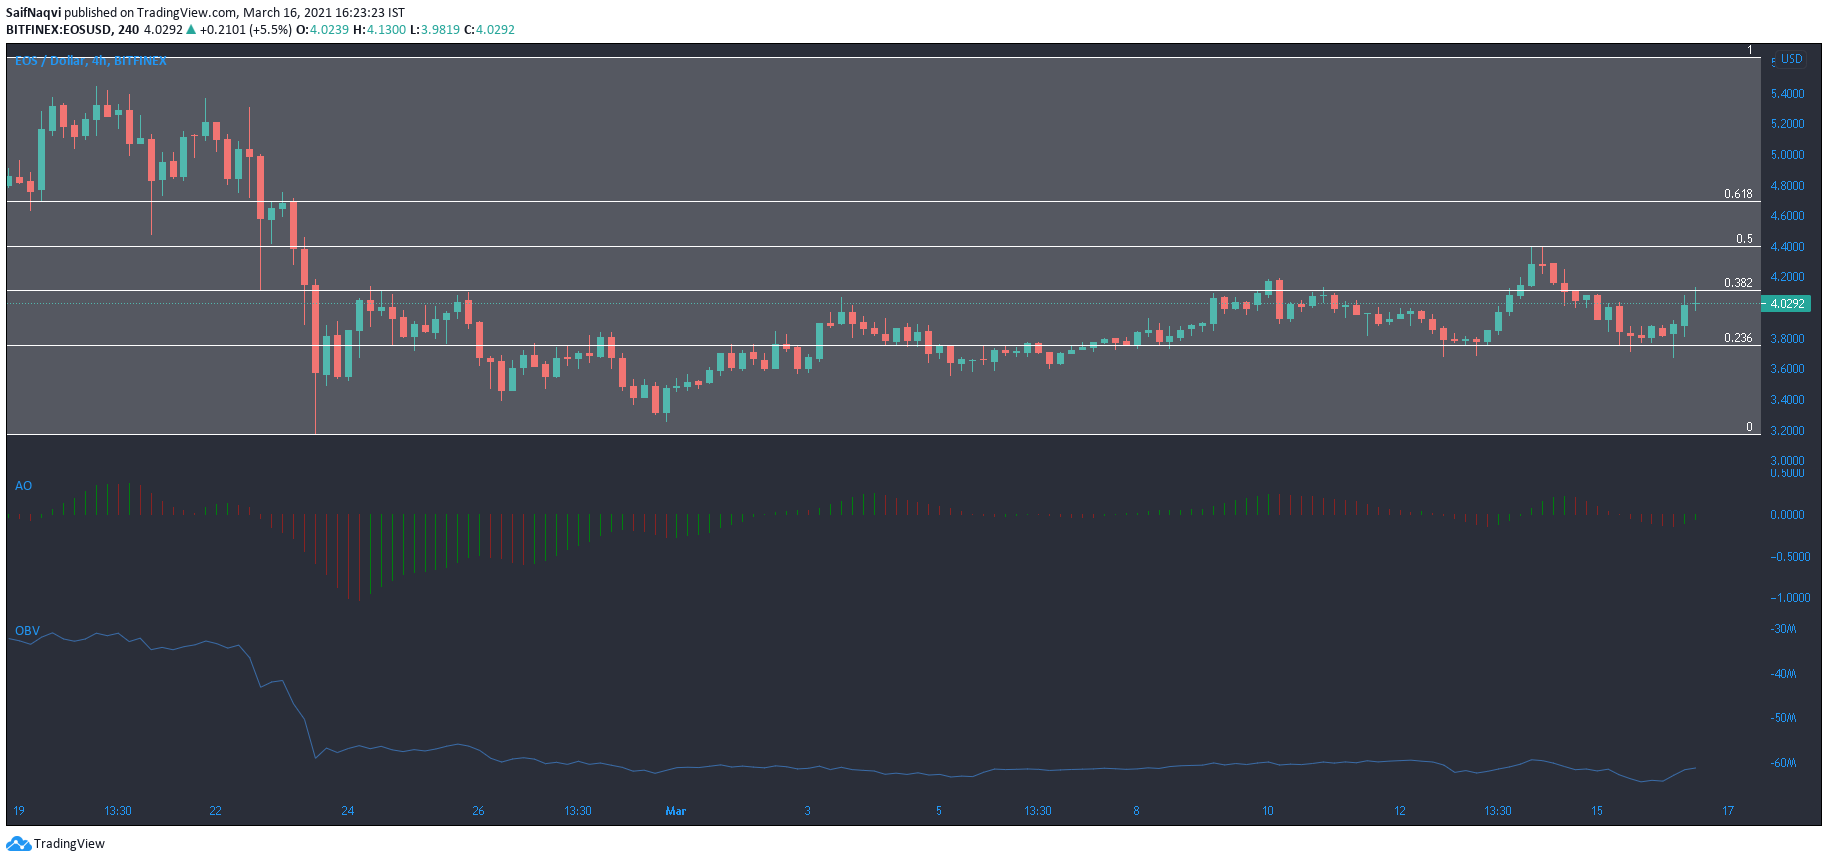
A hike of over 6% in the last 24 hours saw EOS move closer to the 38.2% Fibonacci retracement level which lay at $4.1. Trading volumes rose north at over $2.7 billion, and the OBV noted an uptick in buying activity. Finally, the Awesome Oscillator also recorded some momentum on the bullish side after forming successive green bars.
Taking into account all of the positive signals in the market, EOS can be backed to rise above its overhead resistance in the short-term. However, the bulls might need to negotiate some selling pressure to keep hold of the 38.2% level going forward.
Synthetix [SNX]
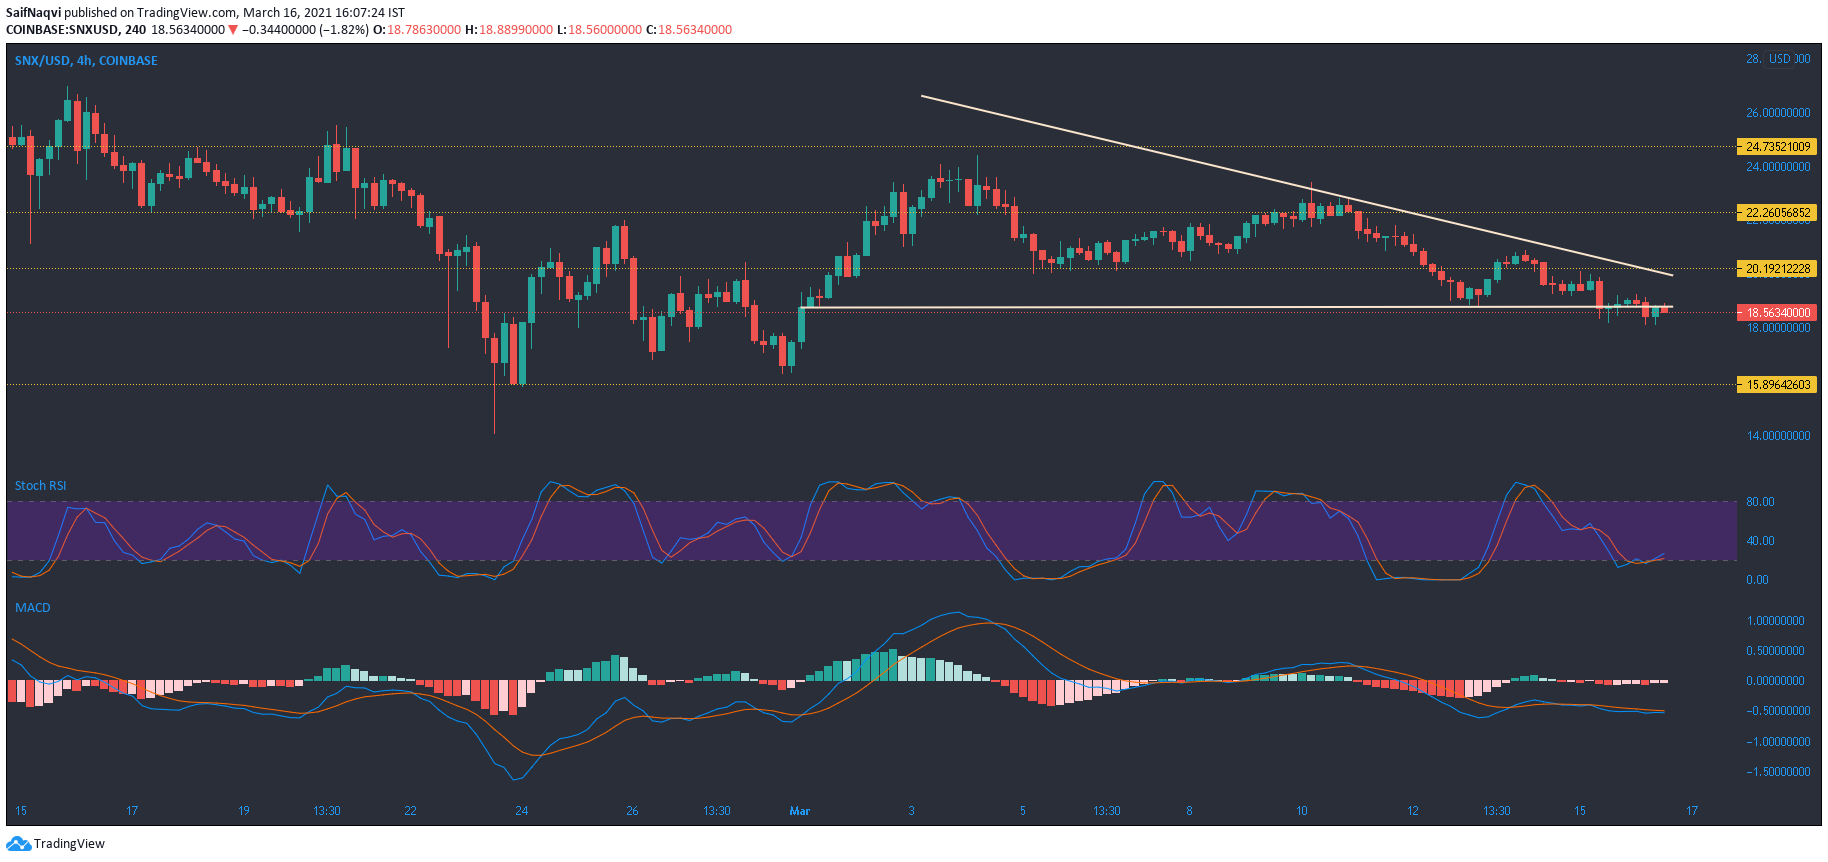
A retest of the lower trendline saw Synthetix move back within its descending channel pattern after the bulls rejected the breakout. Moreover, the indicators were slightly tilted towards the bullish side, at the time of writing. The Stochastic RSI moved above the oversold zone after a bullish crossover, while the MACD’s histogram registered a fall in bearish momentum even though the Signal line moved above the fast-moving line.
However, the market seemed to be fairly in the balance and a breakdown was still on the cards considering low trading volumes. The support at $15.89 could offer some respite in a bearish outcome.
SushiSwap [SUSHI]
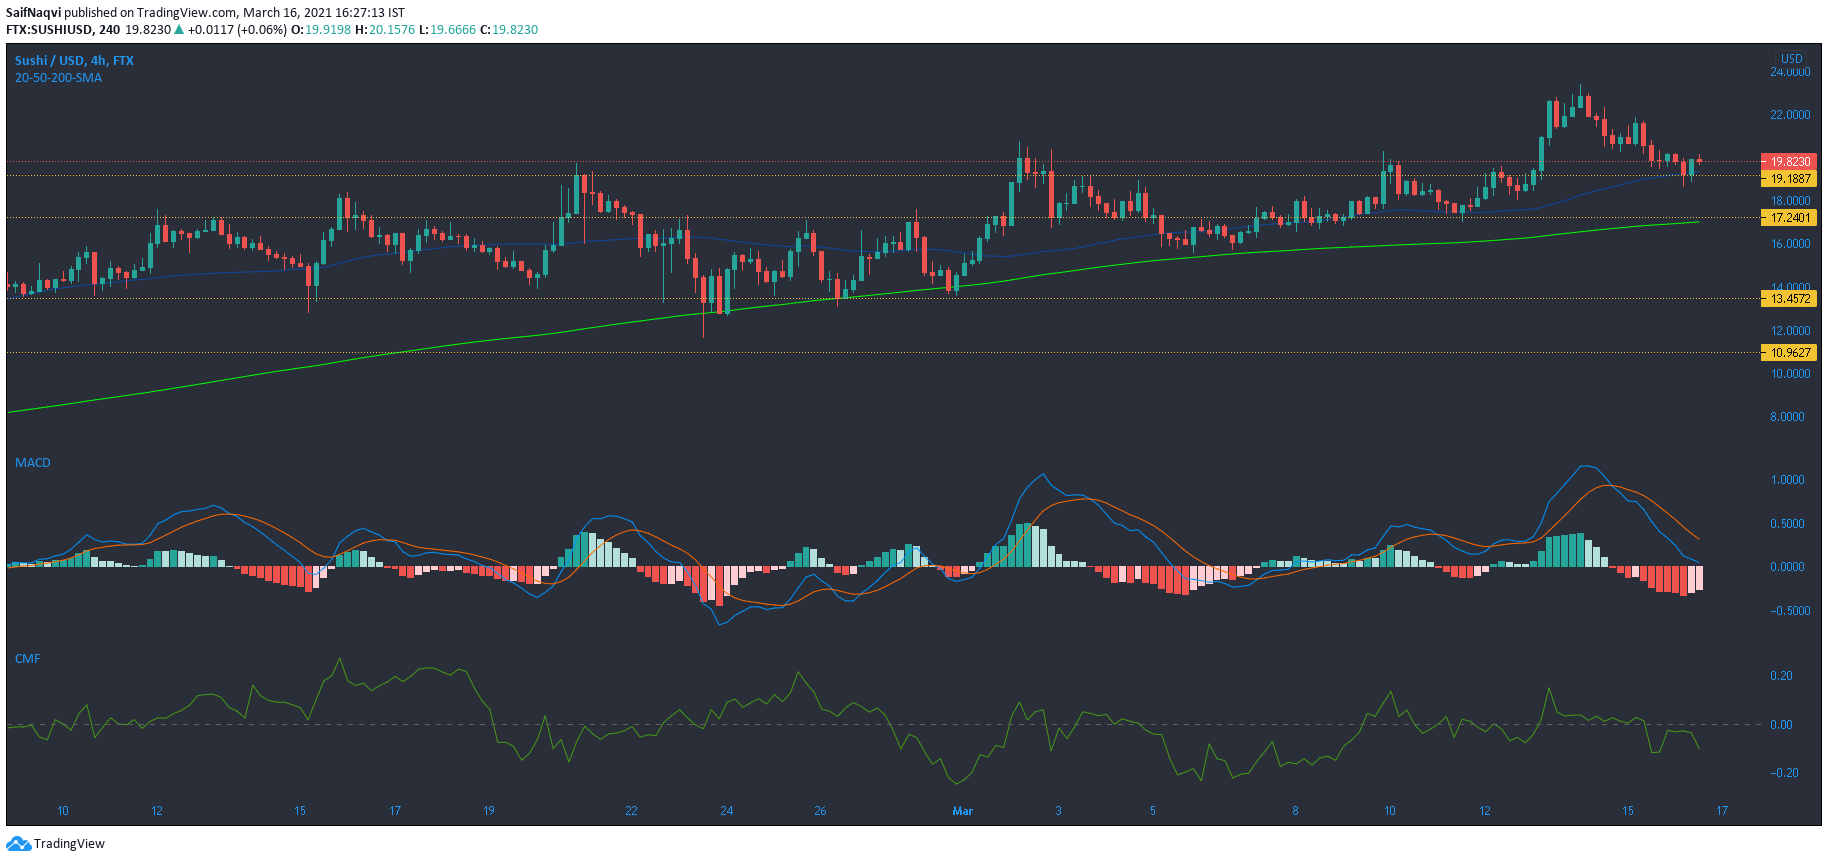
A pullback from record levels saw SUSHI shed over 16% of its value in just two days. At the time of writing, the losses were contained at $19.18, a level that coincided with the 50-SMA (blue). A breakdown from this level would likely see SUSHI move towards its 200-SMA and $17.24-support. However, a fall towards the lower level would likely spur some buying in the market after a stabilization period.
The Chaikin Money Flow showed that SUSHI was maintaining itself above its press time support, even though capital was moving away from the cryptocurrency. The MACD line gained some ground on the Signal line, while the histogram noted weakening bearish momentum.


