What does the sell wall at $23,800 mean for Bitcoin?

When Bitcoin’s price crossed $23,000, the market volatility dropped. With Bitcoin’s price trading within its newly-discovered price range, it seemed to be closely bound to the $22,500-level. In fact, at the time of writing, Bitcoin was valued at well over $23,000.
In such a scenario, $22,300 comes across as the support level, an observation supported by on-chain analyst Joseph Young, based on his recent tweets. In fact, Binance and Bitfinex’s heatmaps showed $23,500 as BTC’s major short-term resistance. However, does this mean that there is room for further price rally or a correction on the charts?
Now, this could be a difficult range for retail traders to trade in, just as there was difficulty in price discovery above $20,000 in the past 4-6 weeks. The wall of profit-takers that emerged past $19,800 may not be a hurdle for the price as the “Supply Shortage” narrative is at play here again.

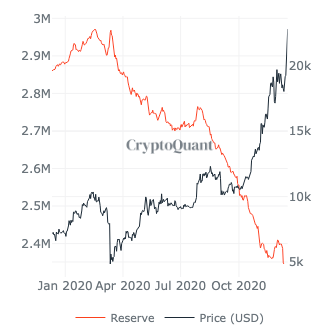
Bitcoin exchange reserves || Source: BTC Reserves
Based on data from Cryptoquant, Bitcoin’s exchange reserves have dropped further. When Bitcoin was struggling for price discovery below $20,000, the reserves plummeted. The active Bitcoin supply 2Y-3Y and 5Y-7Y increased steadily to the point where on-chain analysts were concerned about generating enough demand to absorb the liquidity.
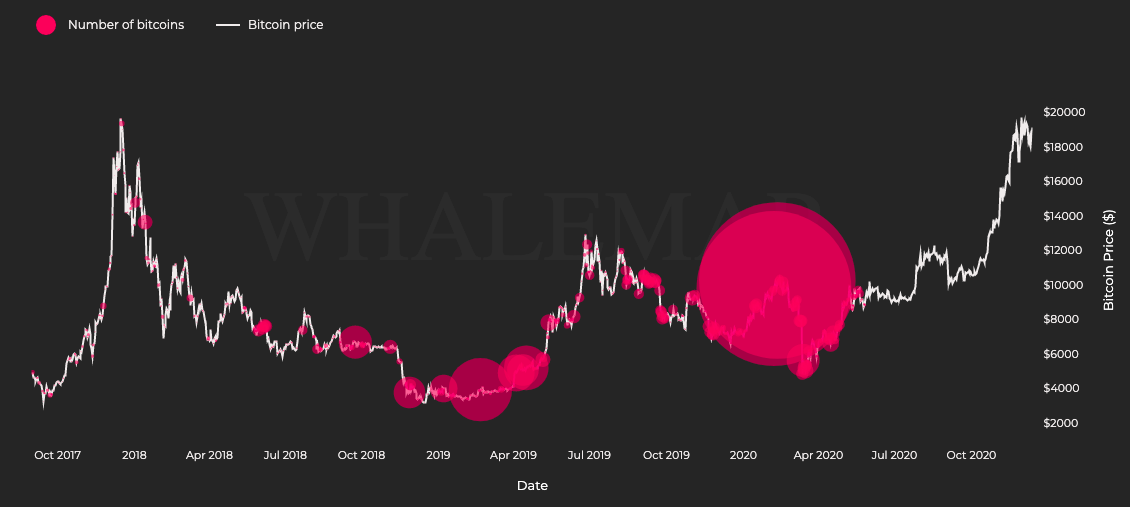
In fact, liquidity hit an ATH earlier last week on spot exchanges. Based on data from Whalemaps, there is more Bitcoin being spent from what was bought 3Y-5Y ago. What has changed primarily since 2017, therefore, are the supply and the controlling entities. The top entities controlling/influencing Bitcoin’s price would be institutions. Rapid institutionalization may have changed the course of Bitcoin’s price discovery just as the halving does, or market cycles do.

Map of unspent Bitcoins || Source: Whalemaps
Based on this chart, the highest volume of unspent Bitcoins was bought a year or less than a year ago. In the past two weeks, the highest volume of unspent Bitcoins is from 2018 and earlier. This is crucial since as Willy Woo noted, despite increasing liquidity, there is a sell wall at $23,800.
How significant is such a sell wall for Bitcoin? Well, Bitcoin exchange reserves have dropped even further to 2.34 million and this may be the lowest level for spot exchanges in this market cycle. Ergo, this sell wall may not so much be indicative of a massive sell-off, when combined with the demand on spot exchanges and the reserves.


