What does this Bitcoin metric say about where we are in this bull run?

Bitcoin has had an eventful 2021, with its price setting a new ATH every few weeks. However, this doesn’t mean that Bitcoin hasn’t had to endure its fair share of bearish pressure. With BTC trading at around $53,000 at the time of writing, one can argue that the push and pull the coin’s price action exhibits is part of its nature and a key part of Bitcoin’s market cycle.
Taking into account past precedents, it is evident that BTC’s market has been quite cyclical with the bulls and the bears trading punches. The 2017 bull run, for instance, was followed by significant bearishness and sideways movement.
However, such a degree of bearishness hasn’t been seen in the current bull run. Despite the building sell pressure, BTC’s market participants are convinced that this is just the halfway market for the coin’s price discovery and this has enabled the world’s largest crypto to maintain a price range that is in close proximity to the coin’s ATH.
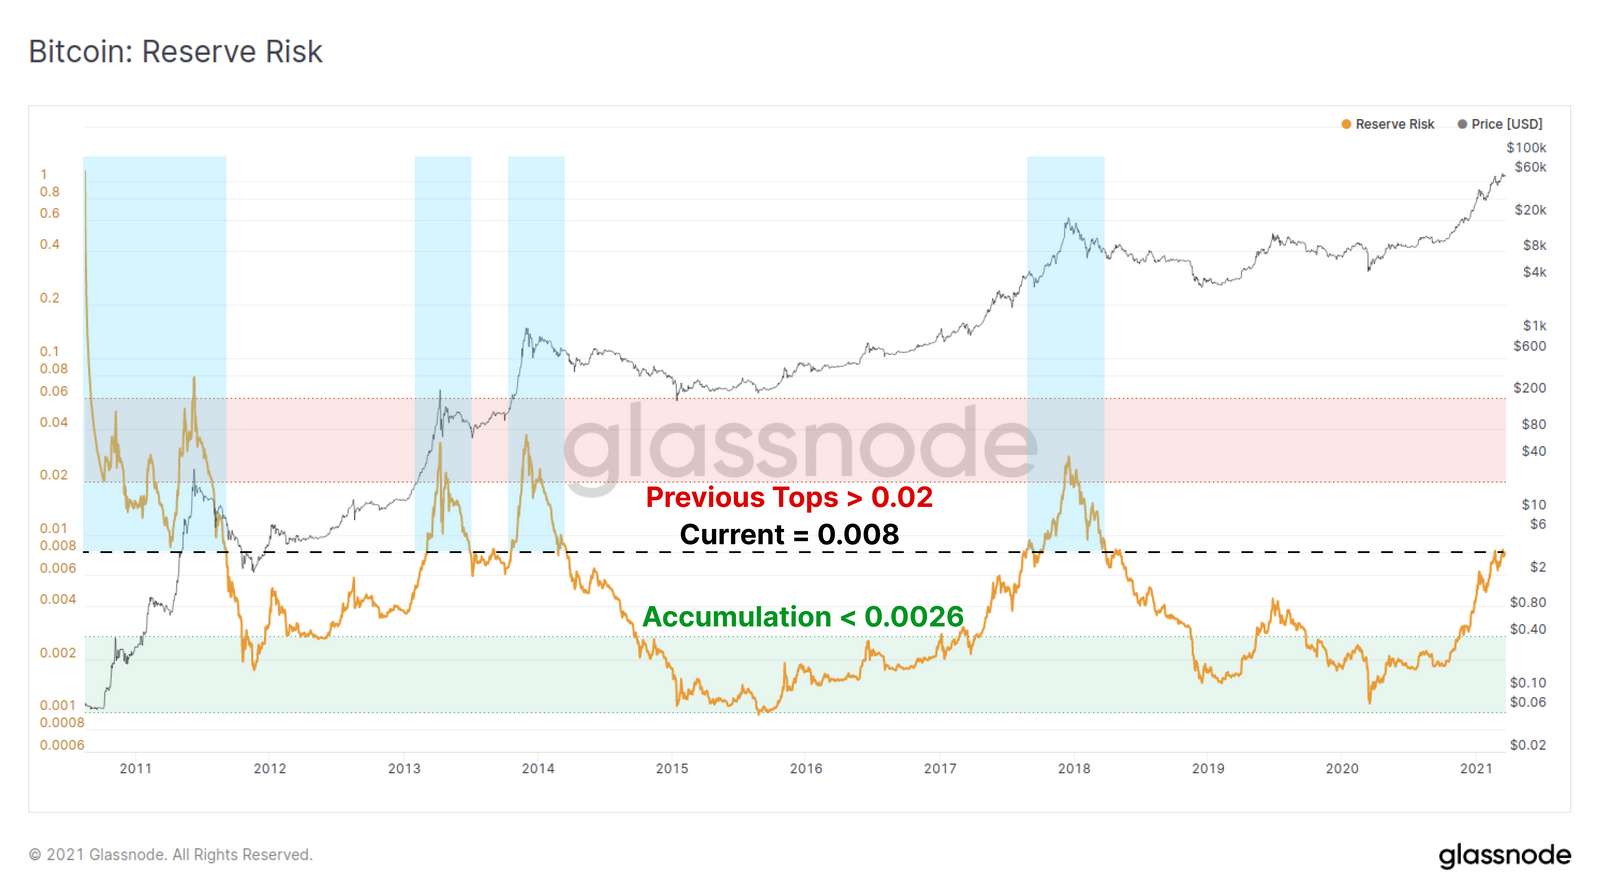
Bitcoin’s market cycles are interesting to observe and according to data provided by Glassnode, the Reserve Risk indicator can provide some valuable insight into the current market cycle.
The metric tracks the conviction of HODLers as we move through various stages of the cycle and according to the same, there is a “wealth transfer” that is taking place in Bitcoin’s market as long-term hodlers sell and enable new buyers to enter the market. As the price rises and/or more HODLers spend their coins, Reserve Risk will increase, as evidenced by the 2017 bull run which noted the highest reserve risk value for BTC.
The fact that this metric is on the rise and hasn’t hit a peak goes on to suggest that the bull run hasn’t concluded and despite the recent dip, a bounceback can be expected.
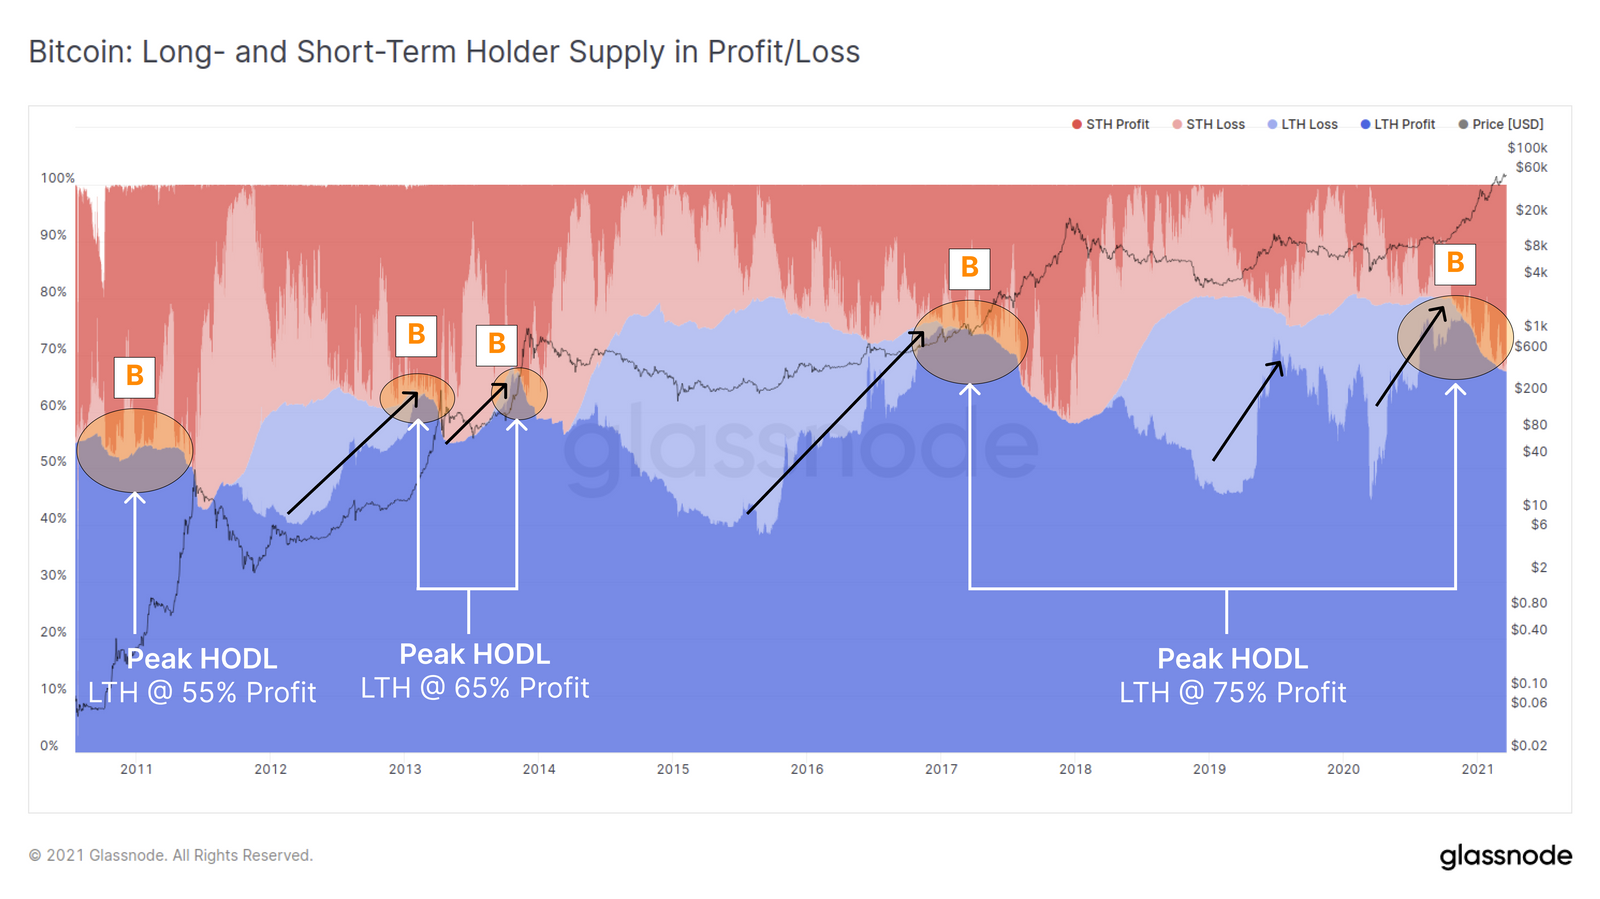
Glassnode also highlighted the three key phases of a Bitcoin cycle and postulated that in the first phase, long-term holders start accumulating (at an immediate loss) around halfway into the bear market. This is followed by the second phase in which the price is a lot more encouraging and LTHs are tempted to sell. And finally, in the third stage, the market reaches a top as more LTHs spend their coins following the Peak HODL inflection point The report highlighted,
“As the bull market progresses, higher prices create larger temptations for HODLers to spend coins. At some stage we hit ‘Peak HODL’, an inflection point where the largest proportion of LTH owned coins are in profit. “
Interestingly according to the data provided, one can argue that there remains a larger relative portion of supply still held by LTHs having only spent 9% since the assumed Peak HODL point. In fact, this also goes to show that we are currently in the second half or the latter stages of a bull market.


