
Disclaimer: The findings of the following analysis are the sole opinions of the writer and should not be considered investment advice
Ethereum Classic [ETC] has been on a gradual revival phase after rebounding from its year-long support near the $17-mark. Post the previous liquidations, the altcoin flipped its 15-month support to resistance (white).
ETC’s recent jump above the 20 EMA (red) and the 50 MEA (cyan) has reflected an uptick in buying pressure.
A bounce-back from its immediate support would lead the alt to a likely retest of the $24-resistance. At press time, ETC traded at $23.89, down by 1.17% in the last 24 hours.
ETC 4-hour Chart

Source: TradingView, ETC/USDT
The steep plunge from its late March highs pulled ETC below some vital price points. During this phase, ETC chalked out a two-month trendline resistance turned support (yellow). This trendline has served as an important area during the decline phase.
The 69.43% retracement led the alt to poke its 13-month low on 12 May. However, the rebound from this level gave the buyers enough thrust to find a close above the 20/50 EMA.
The last few days marked a low volatility phase while the price hovered around the Point of Control (POC, red) region. To escape this squeeze phase, the buyers need to have enough firepower to challenge the $24-resistance. This level is a confluence of horizontal resistance alongside the 200 EMA (green).
Should the current candlestick close as a bearish engulfing stick, this would affirm the existence of an evening star setup. In this case, the alt would see a continued sluggish phase near the POC region.
The investors/traders must wait for a close beyond the chains of the 200 EMA to place buying bets.
Rationale
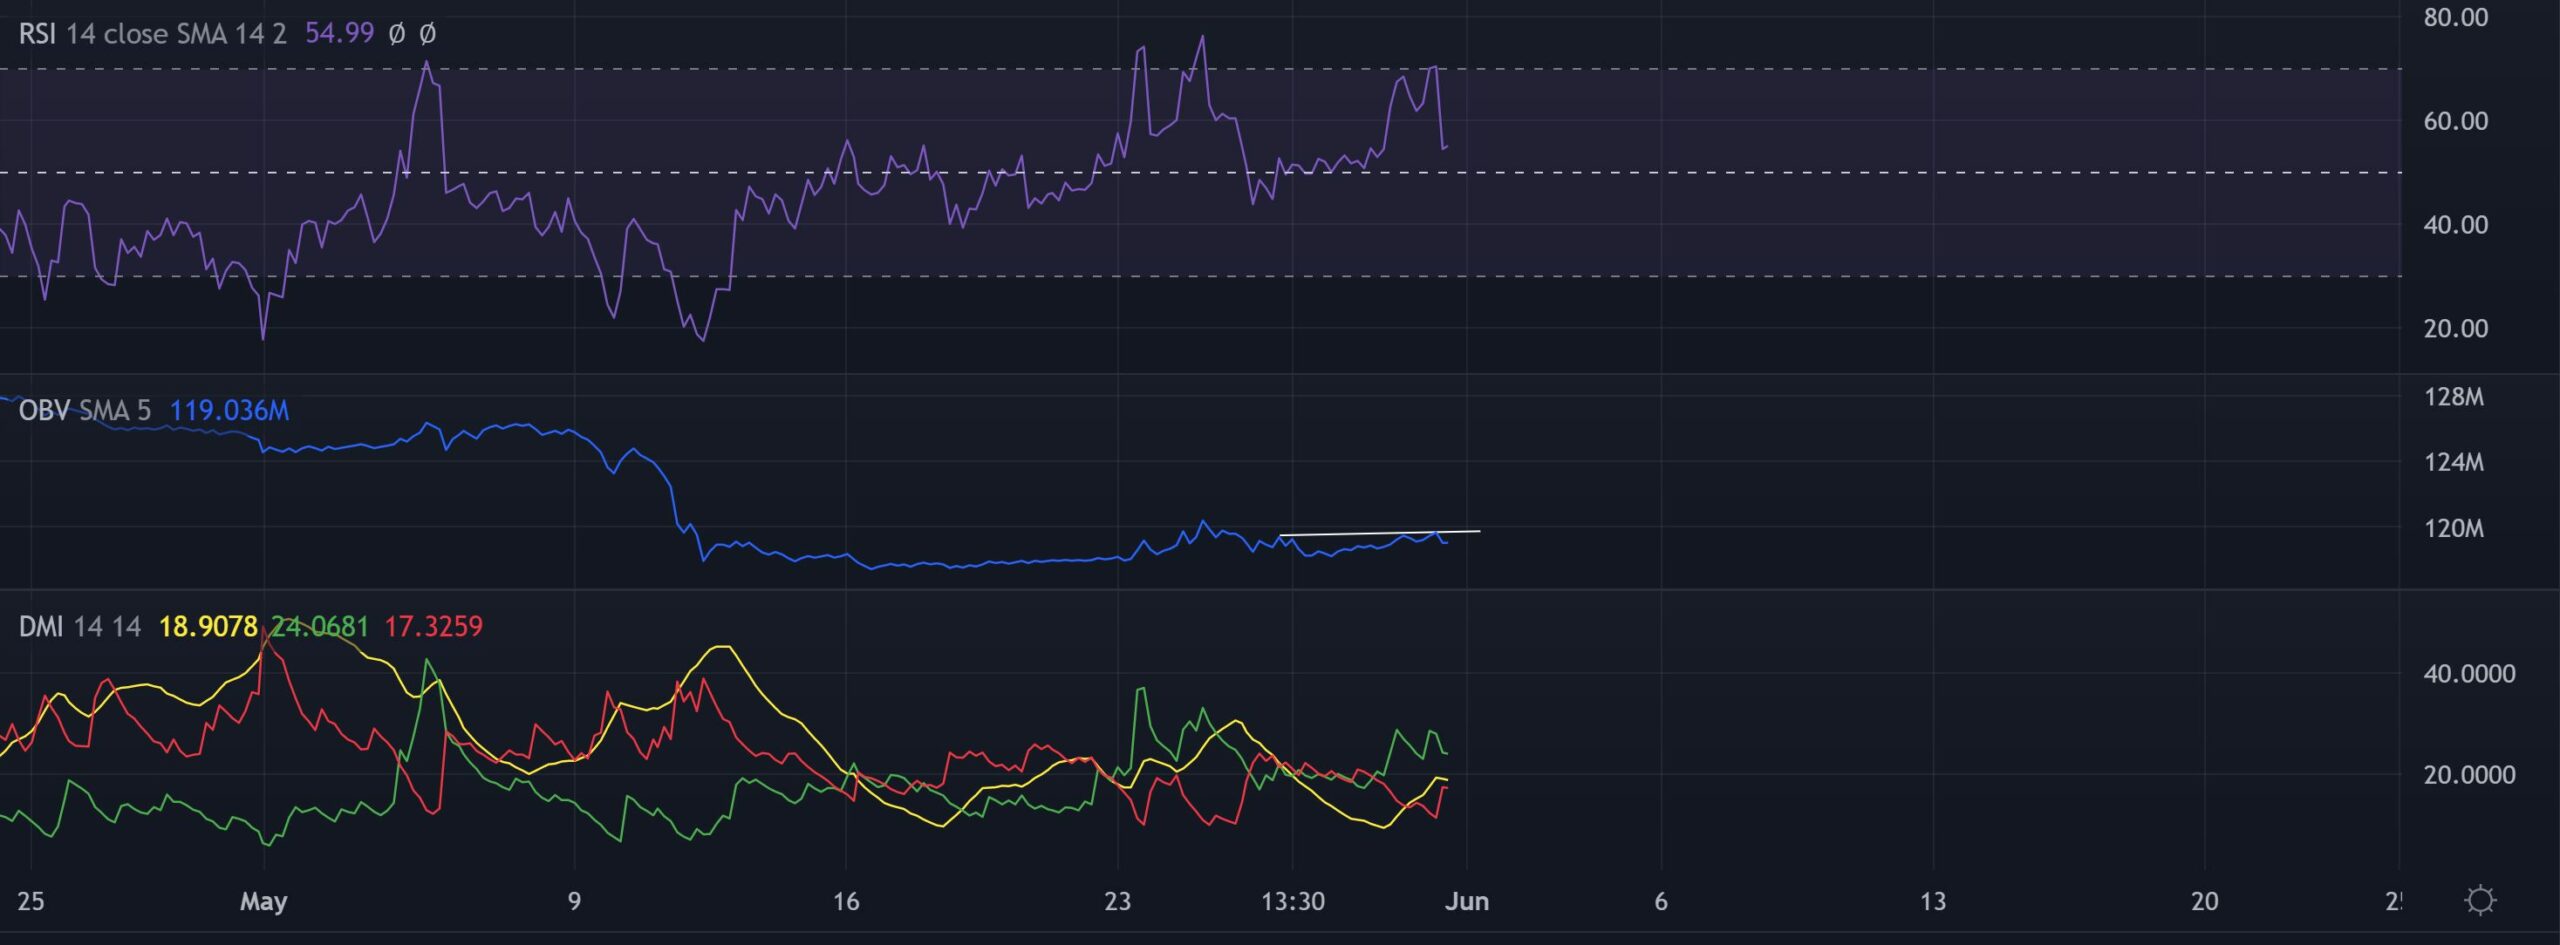
Source: TradingView, ETC/USDT
The Relative Strength Index pulled back after approaching the overbought region. Should the midline support stand sturdy, the bulls could have a window to step in and continue a gradual revival on the chart.
Over the last four days, the OBV failed to mark any higher peaks and thus confirmed a relatively ‘weak’ bearish divergence with price.
Also, with the +DI looking south, the buying pressure seemed to ease. Besides, the alt revealed a weak directional trend [ADX] since the last week.
Conclusion
Should ETC find a rebounding opportunity at its immediate trendline resistance, it could aim to challenge the bonds of its 200 EMA. A close beyond this level would open doorways for a take-profit in the $27-$29 range.
However, the evening star candlestick setup could potentially delay the recent revival phase. Finally, the broader market sentiment and the on-chain developments would play a vital role in influencing future movements.
![Bitcoin [BTC]](https://ambcrypto.com/wp-content/uploads/2025/06/1000001598-400x240.webp)


