What Ethereum Classic is up to after its recent massive 60% rally

Disclaimer: The findings of the following analysis are the sole opinions of the writer and should not be considered investment advice
Ethereum Classic was trading at $49.25 at the time of writing. It has made enormous bullish strides in the past few days as it smashed its way past multiple levels of resistance. Can Ethereum Classic flip the $50 area to demand? If it does, a run to $57 and $60 can materialize. A rejection at the resistance level was less likely, but it could see ETC revisit the $45 area.
ETC- 1H
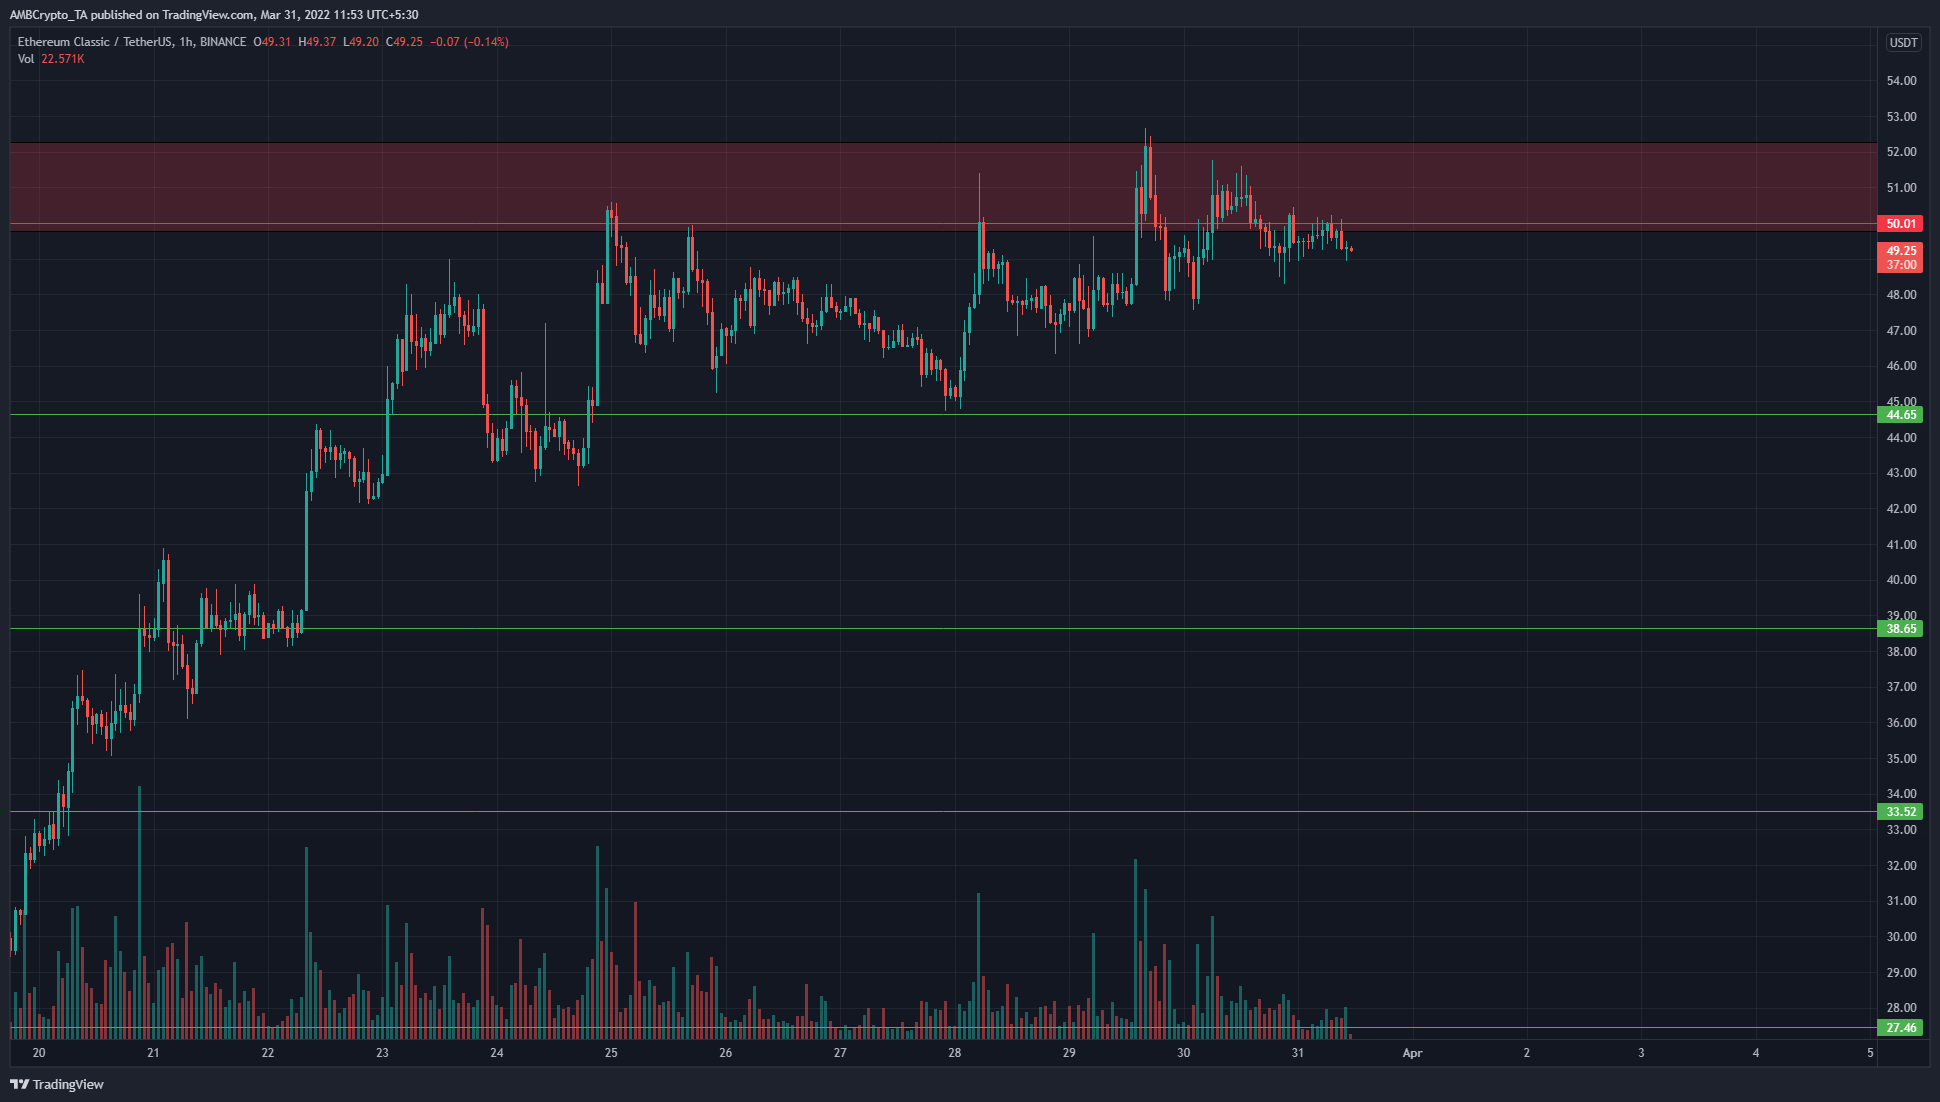
In the $50-$52 area lies a zone of supply that ETC previously traded at in mid-November. The fact that the asset has climbed this far in the months since was encouraging for the bulls.
The $50 is both a long-term horizontal as well as a psychological resistance level. Since the time ETC broke above the $27 level two weeks ago, it has known only upside with minor pullbacks. On the hourly timeframe, the price appeared to struggle to push past the $50 level.
In fact, in the past 48 hours, the price has been in a compression, where it registered both lower highs and higher lows. This was indicative of imminent and significant volatility.
Rationale
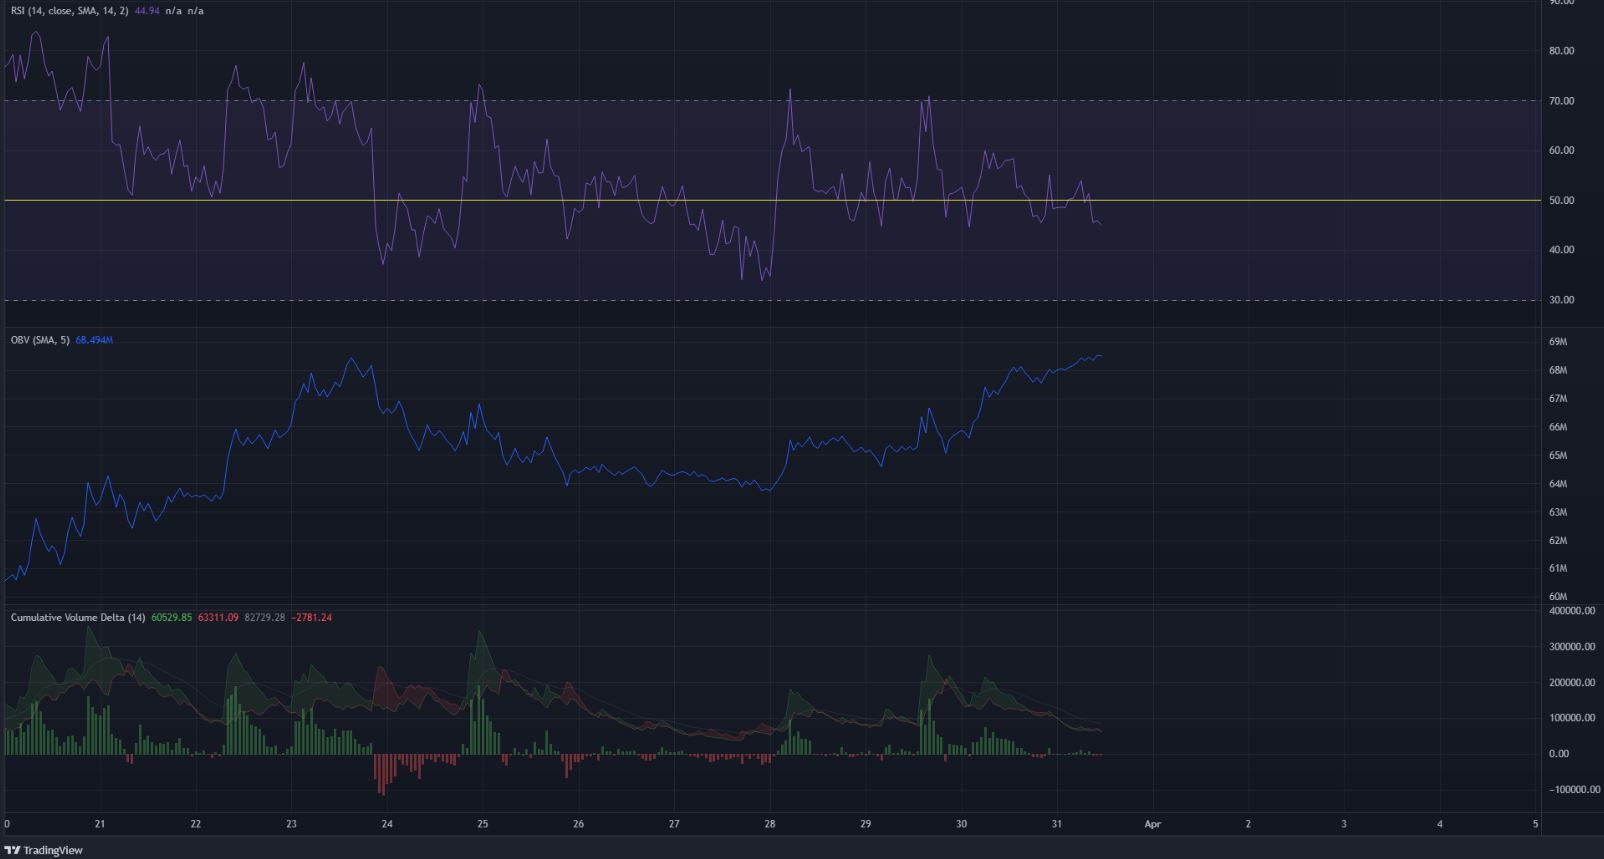
The RSI dipped below neutral 50 but has not yet dropped below 40. This meant bearish momentum had not yet become dominant. The OBV has been rising even as the price compressed. This suggested that ETC could dip toward $46-$47 to hunt for liquidity before roaring back northward.
The CVD has been green for the majority of last week, but on the previous day, it did not lean strongly in favor of either the buyers or the sellers. This was further evidence of the compression on the price charts in recent hours.
Conclusion
The OBV showed steady and high buying volume and the price was in a phase of consolidation before the expansion. All this was happening right beneath a highly significant resistance level. This showed that, in the next few days, ETC could see a dip toward $46 but was also likely to burst past $50.