What is the likelihood of Cardano embarking on another bull run by 11 January

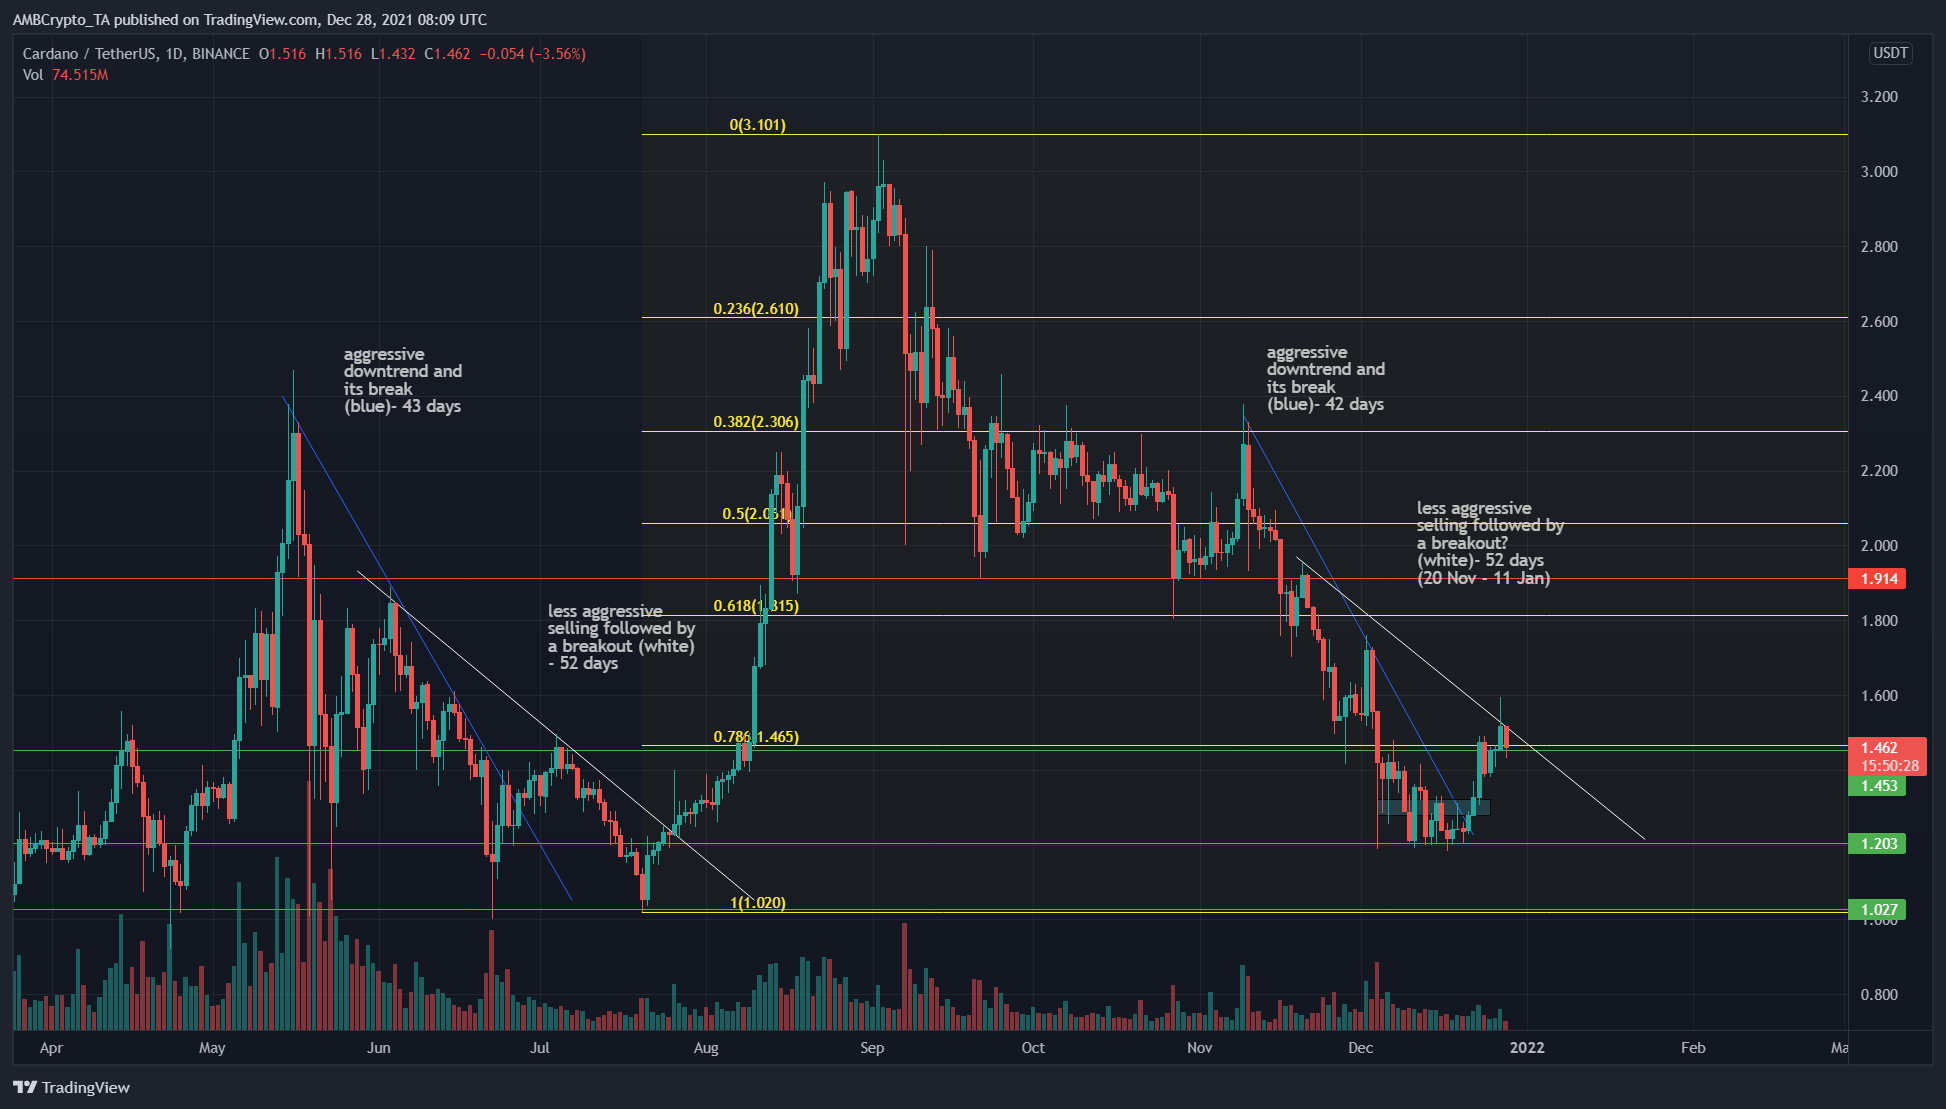
Cardano was trading at $1.46 at the time of writing. Sellers had emerged in the $1.6 area and pushed the price down to $1.46. This was a strong support level, but the downtrend on higher time frames, was not yet over for Cardano.
However, there were some encouraging signs. Going into 2022, a bullish Bitcoin could see ADA break the downtrend, as it did earlier this year.
ADA — 1 day-chart

Source: ADA/USDT on TradingView
The swing lows and highs at $1.02 and $3.1 respectively were used to plot Fibonacci retracement levels. The 23.6% level was in confluence with a high time frame support at $1.45. Also, the $1.71-$1.8 area was also a zone where sellers have been very strong in the past.
On the price chart, the similarity between the price action of the past few weeks has been quite similar to the price action in May and June. There are also contextual differences. The differences are as follows. In May, an explosive pump was followed by a rapid sell-off. In September, $3 was met and the sell-off was aggressive till $1.9, some slow decline, then another aggressive sell-off in November to reach $1.
The similarities are the trendline resistance touches in two phases (blue and white) and the similarity of their time duration. 42 and 43 days of a downtrend, 52 days of less aggressive selling. But the question is- Could this repeat once again?
Rationale

Source: ADA/USDT on TradingView
The possibility can not be dismissed yet, but the contextual differences were also huge. Having said that, the $1.46 area is a strong region that would likely not be broken in one attempt.
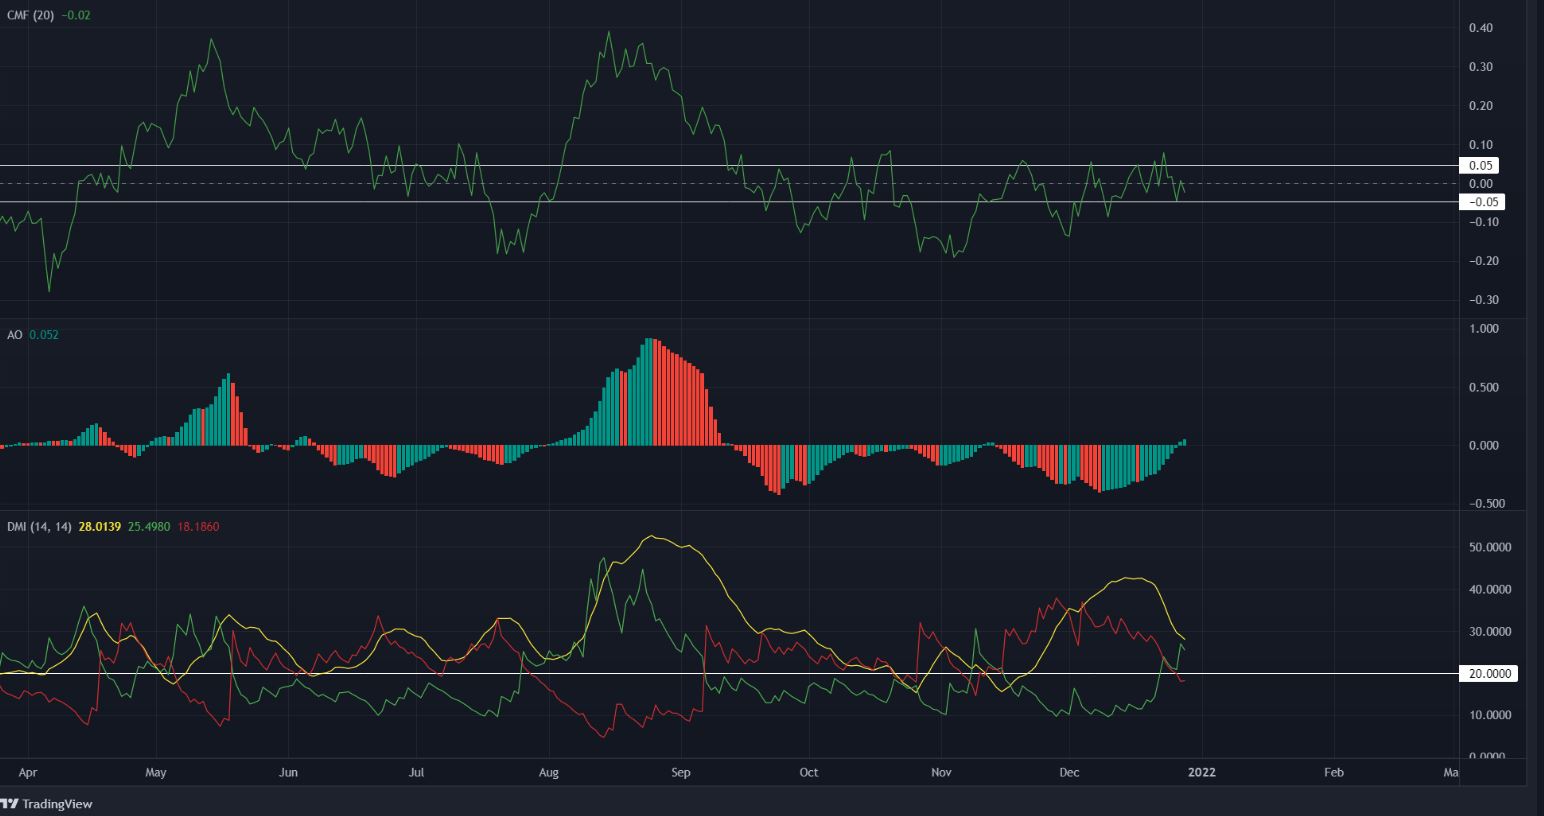
The DMI showed a bull trend in progress, while the Awesome Oscillator also indicated a shift in momentum as it crossed above the zero line to show a bullish flip.
However, the CMF still bounced indecisively between +0.05 and -0.05. Without strong demand, ADA was unlikely to rise past $1.5. That demand was not yet here, according to the CMF.
Conclusion
As indicated on the charts, it was possible that ADA could see rejection in the $1.5 region and form a higher low at $1.3, before pushing upward once more in the coming weeks. Whether that will occur by 11 January is debatable, but there were some notable price action similarities worth exploring.


