What must happen before LUNA’s market bulls can take over

Disclaimer: The findings of the following analysis are the sole opinions of the writer and should not be considered investment advice
After picking itself up from the golden Fibonacci level, Terra (LUNA) grew in an up-channel while marking rampant gains.
Going forward, any close below the trendline support (white) would brace LUNA for a 23.6% Fibonacci support retest. Following this, the alt would likely enter into a volatile phase as the tight phase fades away. At press time, LUNA was trading at $85.16.
LUNA 4-hour chart
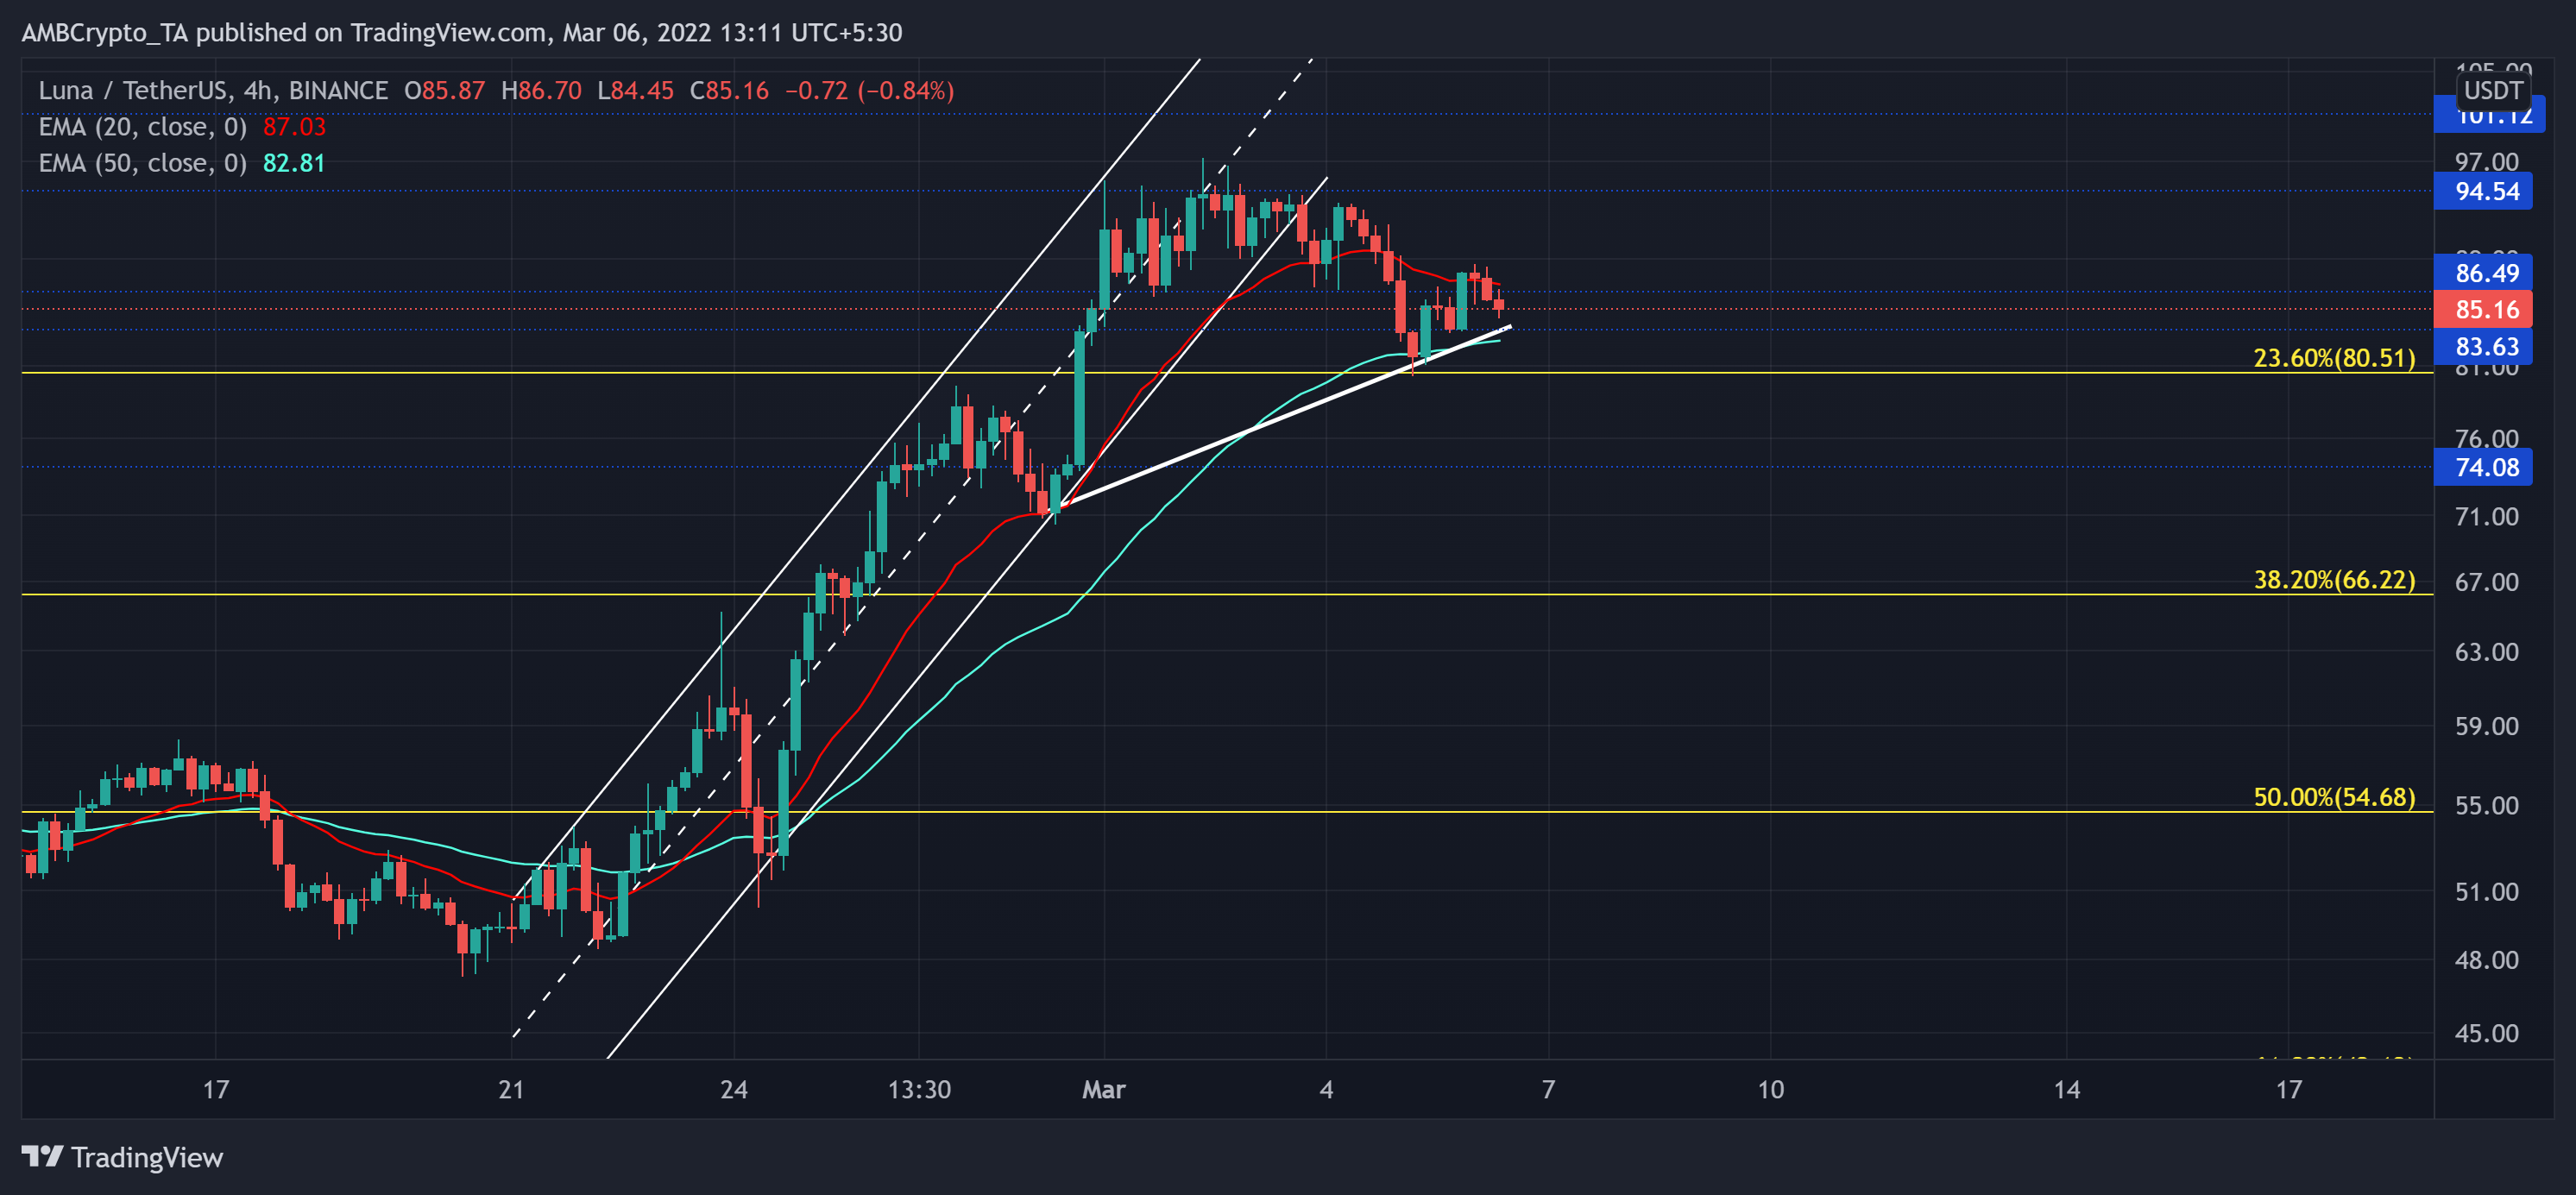
Since its ATH on 27 December, LUNA fell to test and pierce through critical price points. The alt lost more than half its value in the next 35 days as it rushed to poke its one-month on 31 January.
While the 61.8% Fibonacci floor stood sturdy, LUNA propelled an up-rally that bagged in a whopping 108.62% ROI from 20 February until 2 March. The up-channel oscillation on its 4-hour chart helped the alt jump above its 20 EMA (red) and 50 EMA (cyan). As LUNA approached the $94-mark, the bears stepped in to fuel a sharp pullback. Also, historically, the alt has seen a reversal from this resistance.
Now, as the 20 EMA is flipped to immediate resistance from support, a close below the $83-$84 range would cause the price to test its 50 EMA. Post this, if the bears continue to exert sustained power, a further fall towards the 23.6% support could be conceivable.
On the other hand, if the bulls defend the trendline support (white), it would amount to a hidden bullish divergence with its RSI.
Rationale
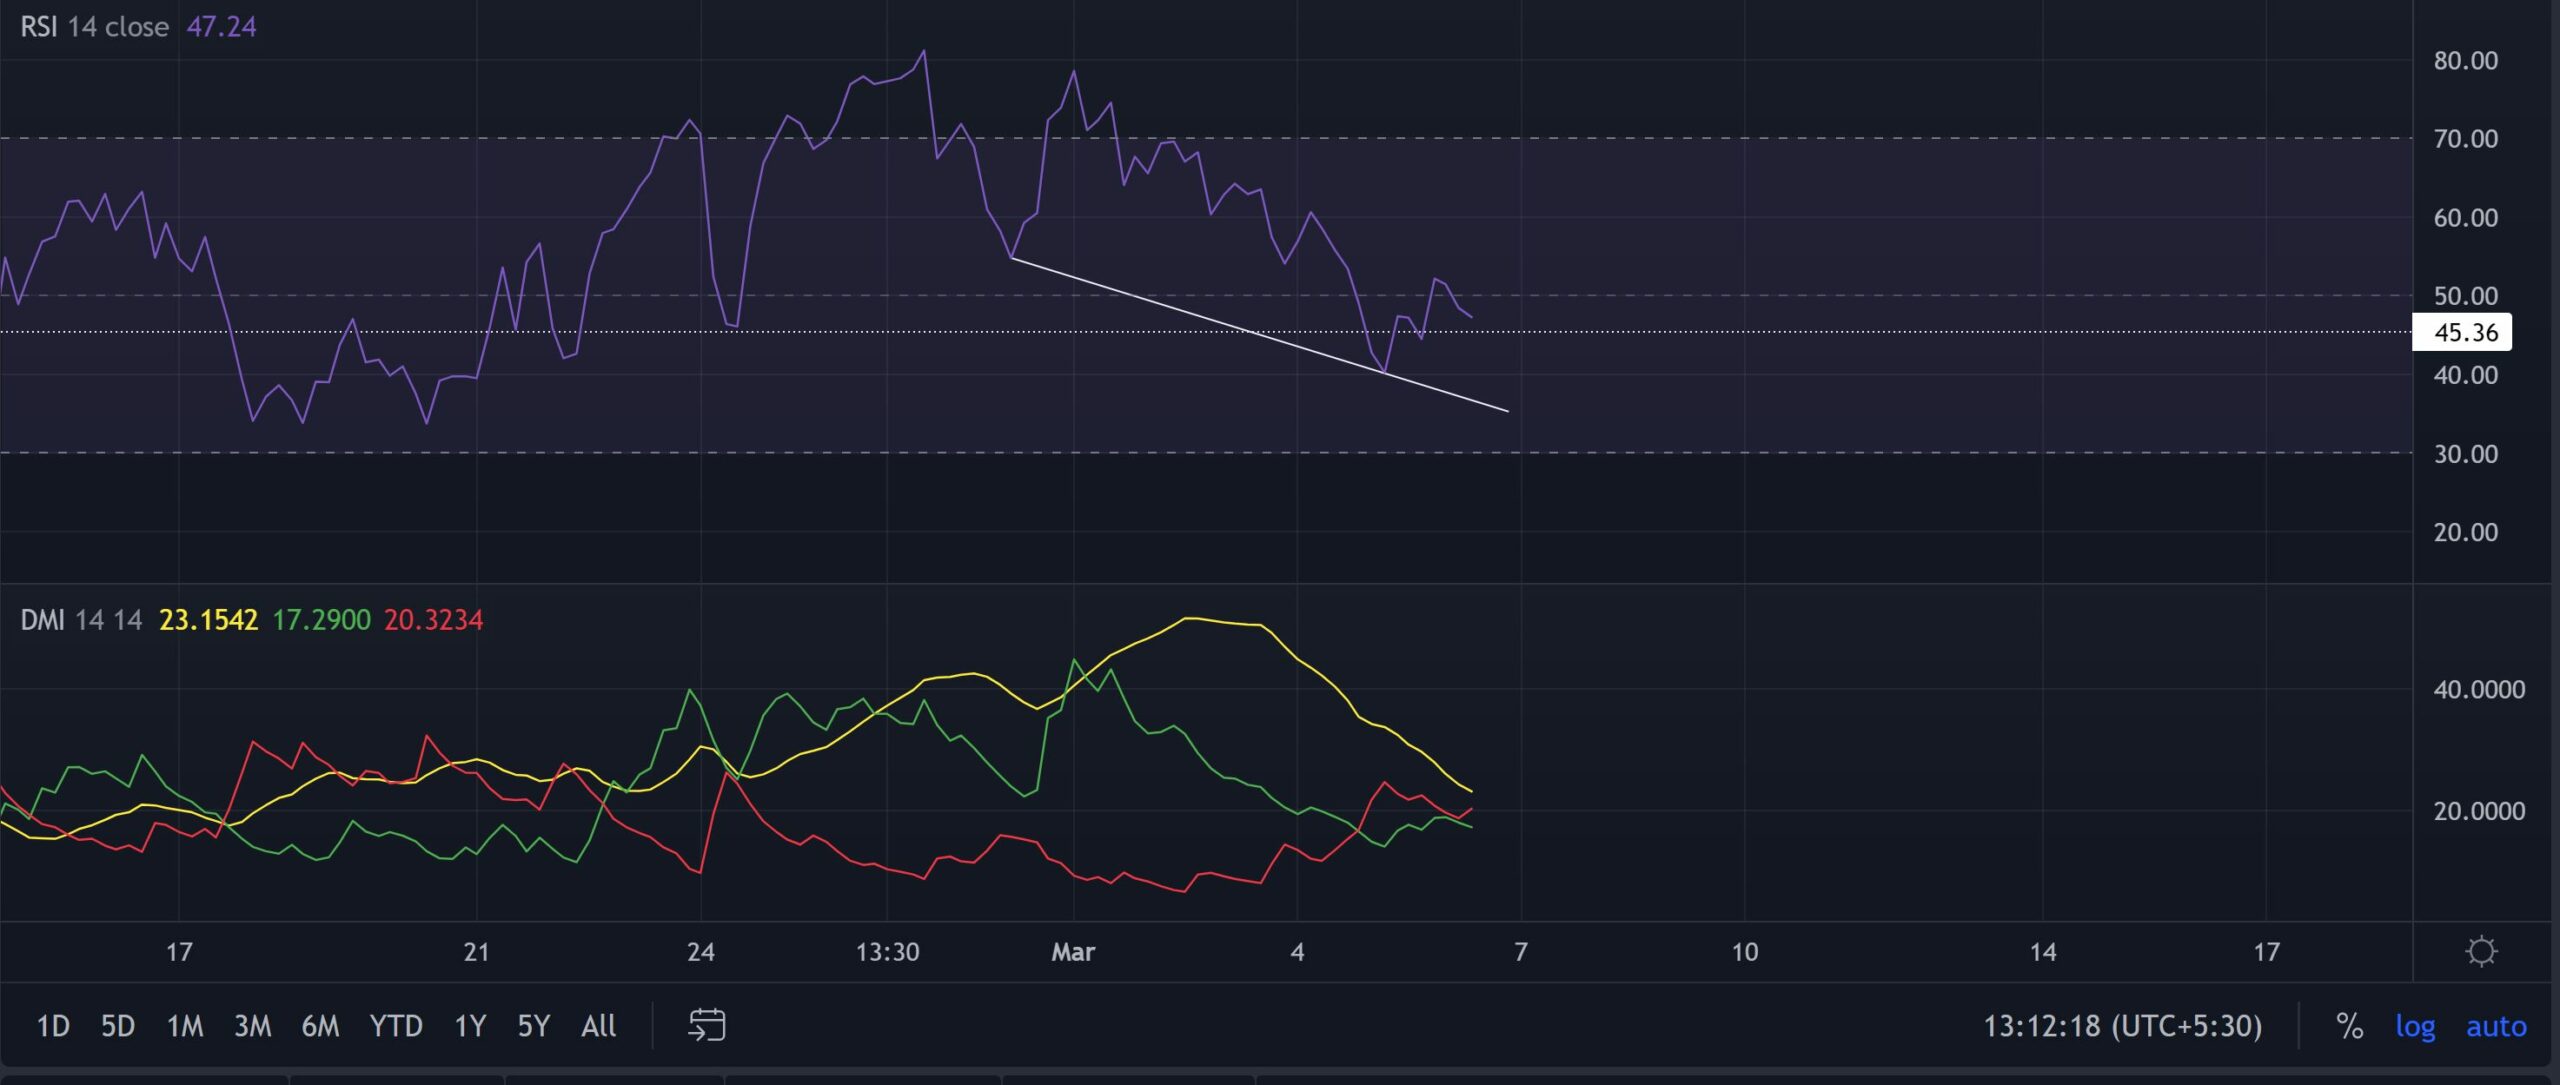
The RSI has steadily declined from its overbought mark since last week. As a result, it plunged below the midline to picture a bearish edge. Now, the 45-mark support would be vital for the bulls to uphold to prevent a further fall towards its trendline support.
Furthermore, the -DI looked north after refraining from undertaking a bullish crossover. This reading would justify the bearish movements in the near term. Alas, its ADX was on a downtrend and flashed a weak directional trend.
Conclusion
The next few candlesticks are critical to confirm a further downtrend. A fall below the immediate support could cause an $80-retest before LUNA makes a trend-committing move.
Having said that, investors/traders must keep a close watch on the broader sentiment affecting the perception of the alt.