What rising USDT, USDC wallets tell you about the market
During the 2020-21 run, the rapidly growing crypto market necessitated enormous amounts of USDT and other stablecoins to be printed.

- The rising stablecoin presence in this run is hugely encouraging for crypto investors.
- The stablecoin supply might expand greatly, like the previous run, to keep up with the demand and liquidity needs.
Stablecoin wallets with a non-zero balance were growing rapidly, Santiment observed in a post on X. This continued to occur even as fears of imminent selling pressure after the halving soared over the past three weeks.
The price action of Bitcoin [BTC] and Ethereum [ETH] has been considerably more bullish in the past week than it was in the latter half of April. What else do the stablecoins reveal about the state of the market?
Growing wallets showed buying power is present
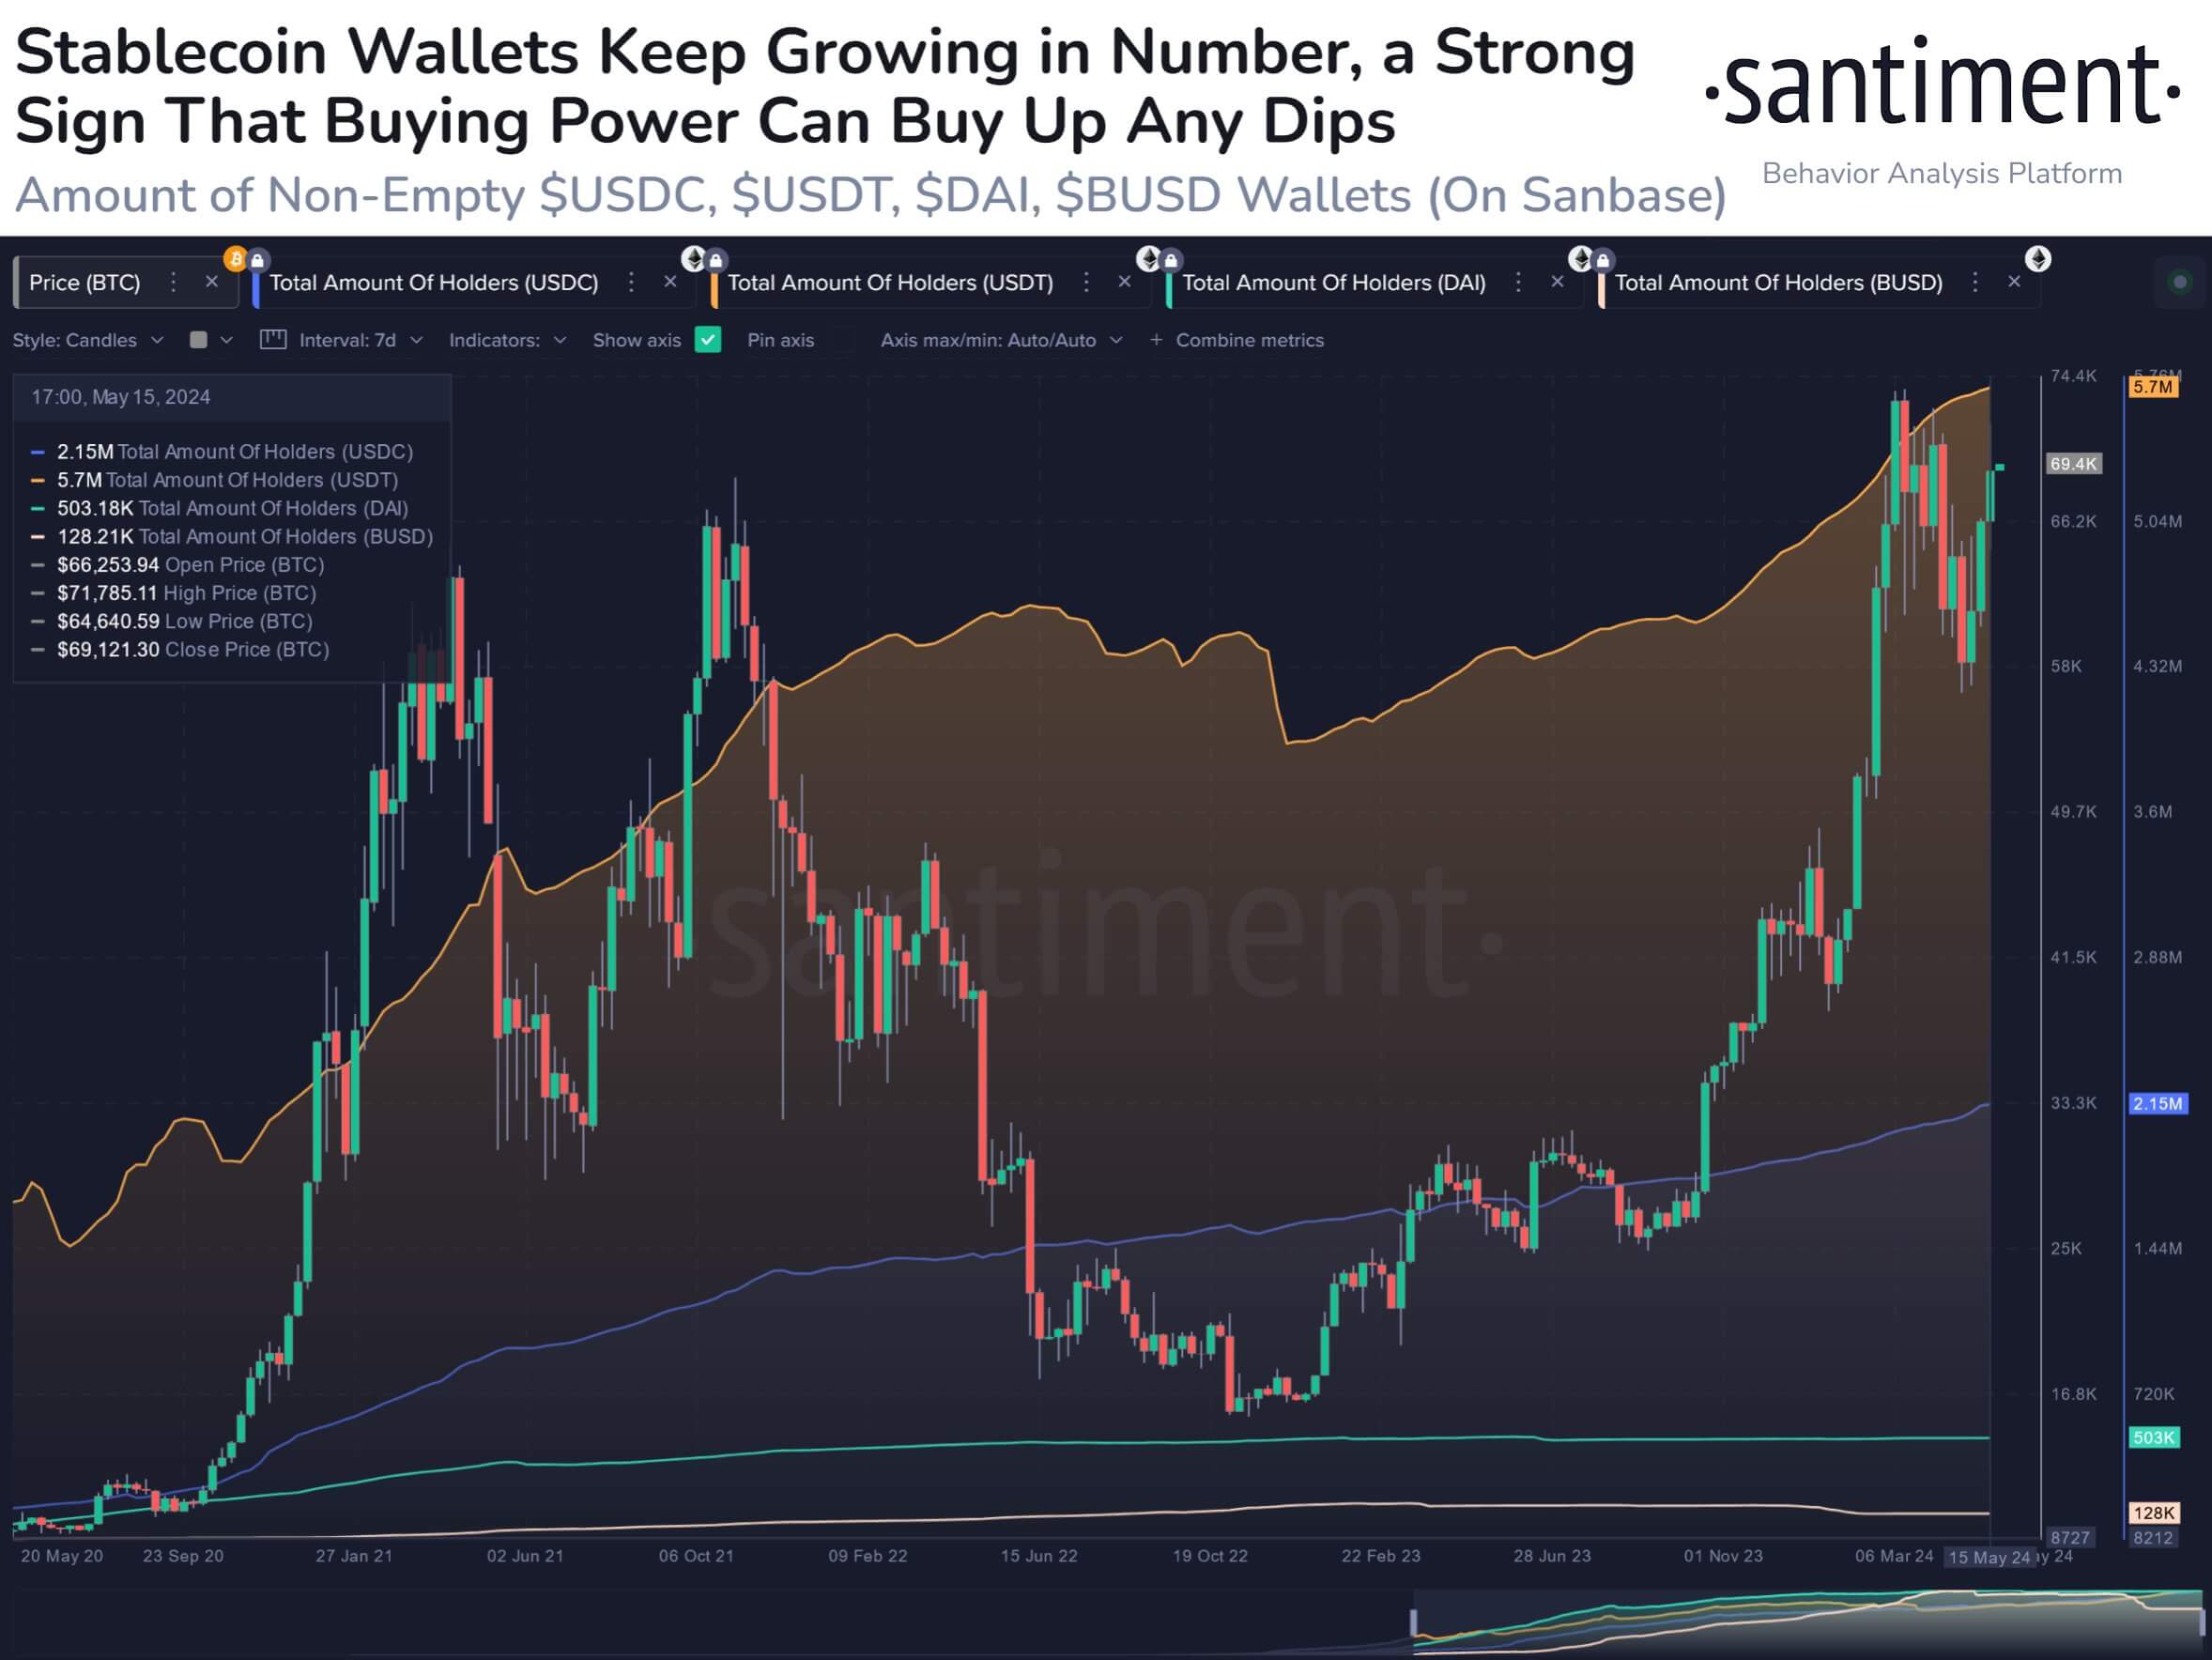
Santiment noted in the post that the USDC non-empty wallets have increased by 13.9%, and Tether wallets by 15.7% in 2024. These are impressive numbers and mirror the rapid growth during the last bull run.
Since December 2019, the total number of USDT non-zero wallets has been rising rapidly for nearly three years till October 2022. Since then the metric saw a quick drop, and a gradual uptrend.
This uptrend accelerated in November 2023, showing non-crypto folks were feeling greater FOMO and more willingness to participate in crypto than ever before. This is a positive sign for the entire space.
The exchange reserve did not mirror the previous bull run
During the 2020-21 run, the rapidly growing crypto market necessitated enormous amounts of USDT and other stablecoins to be printed.
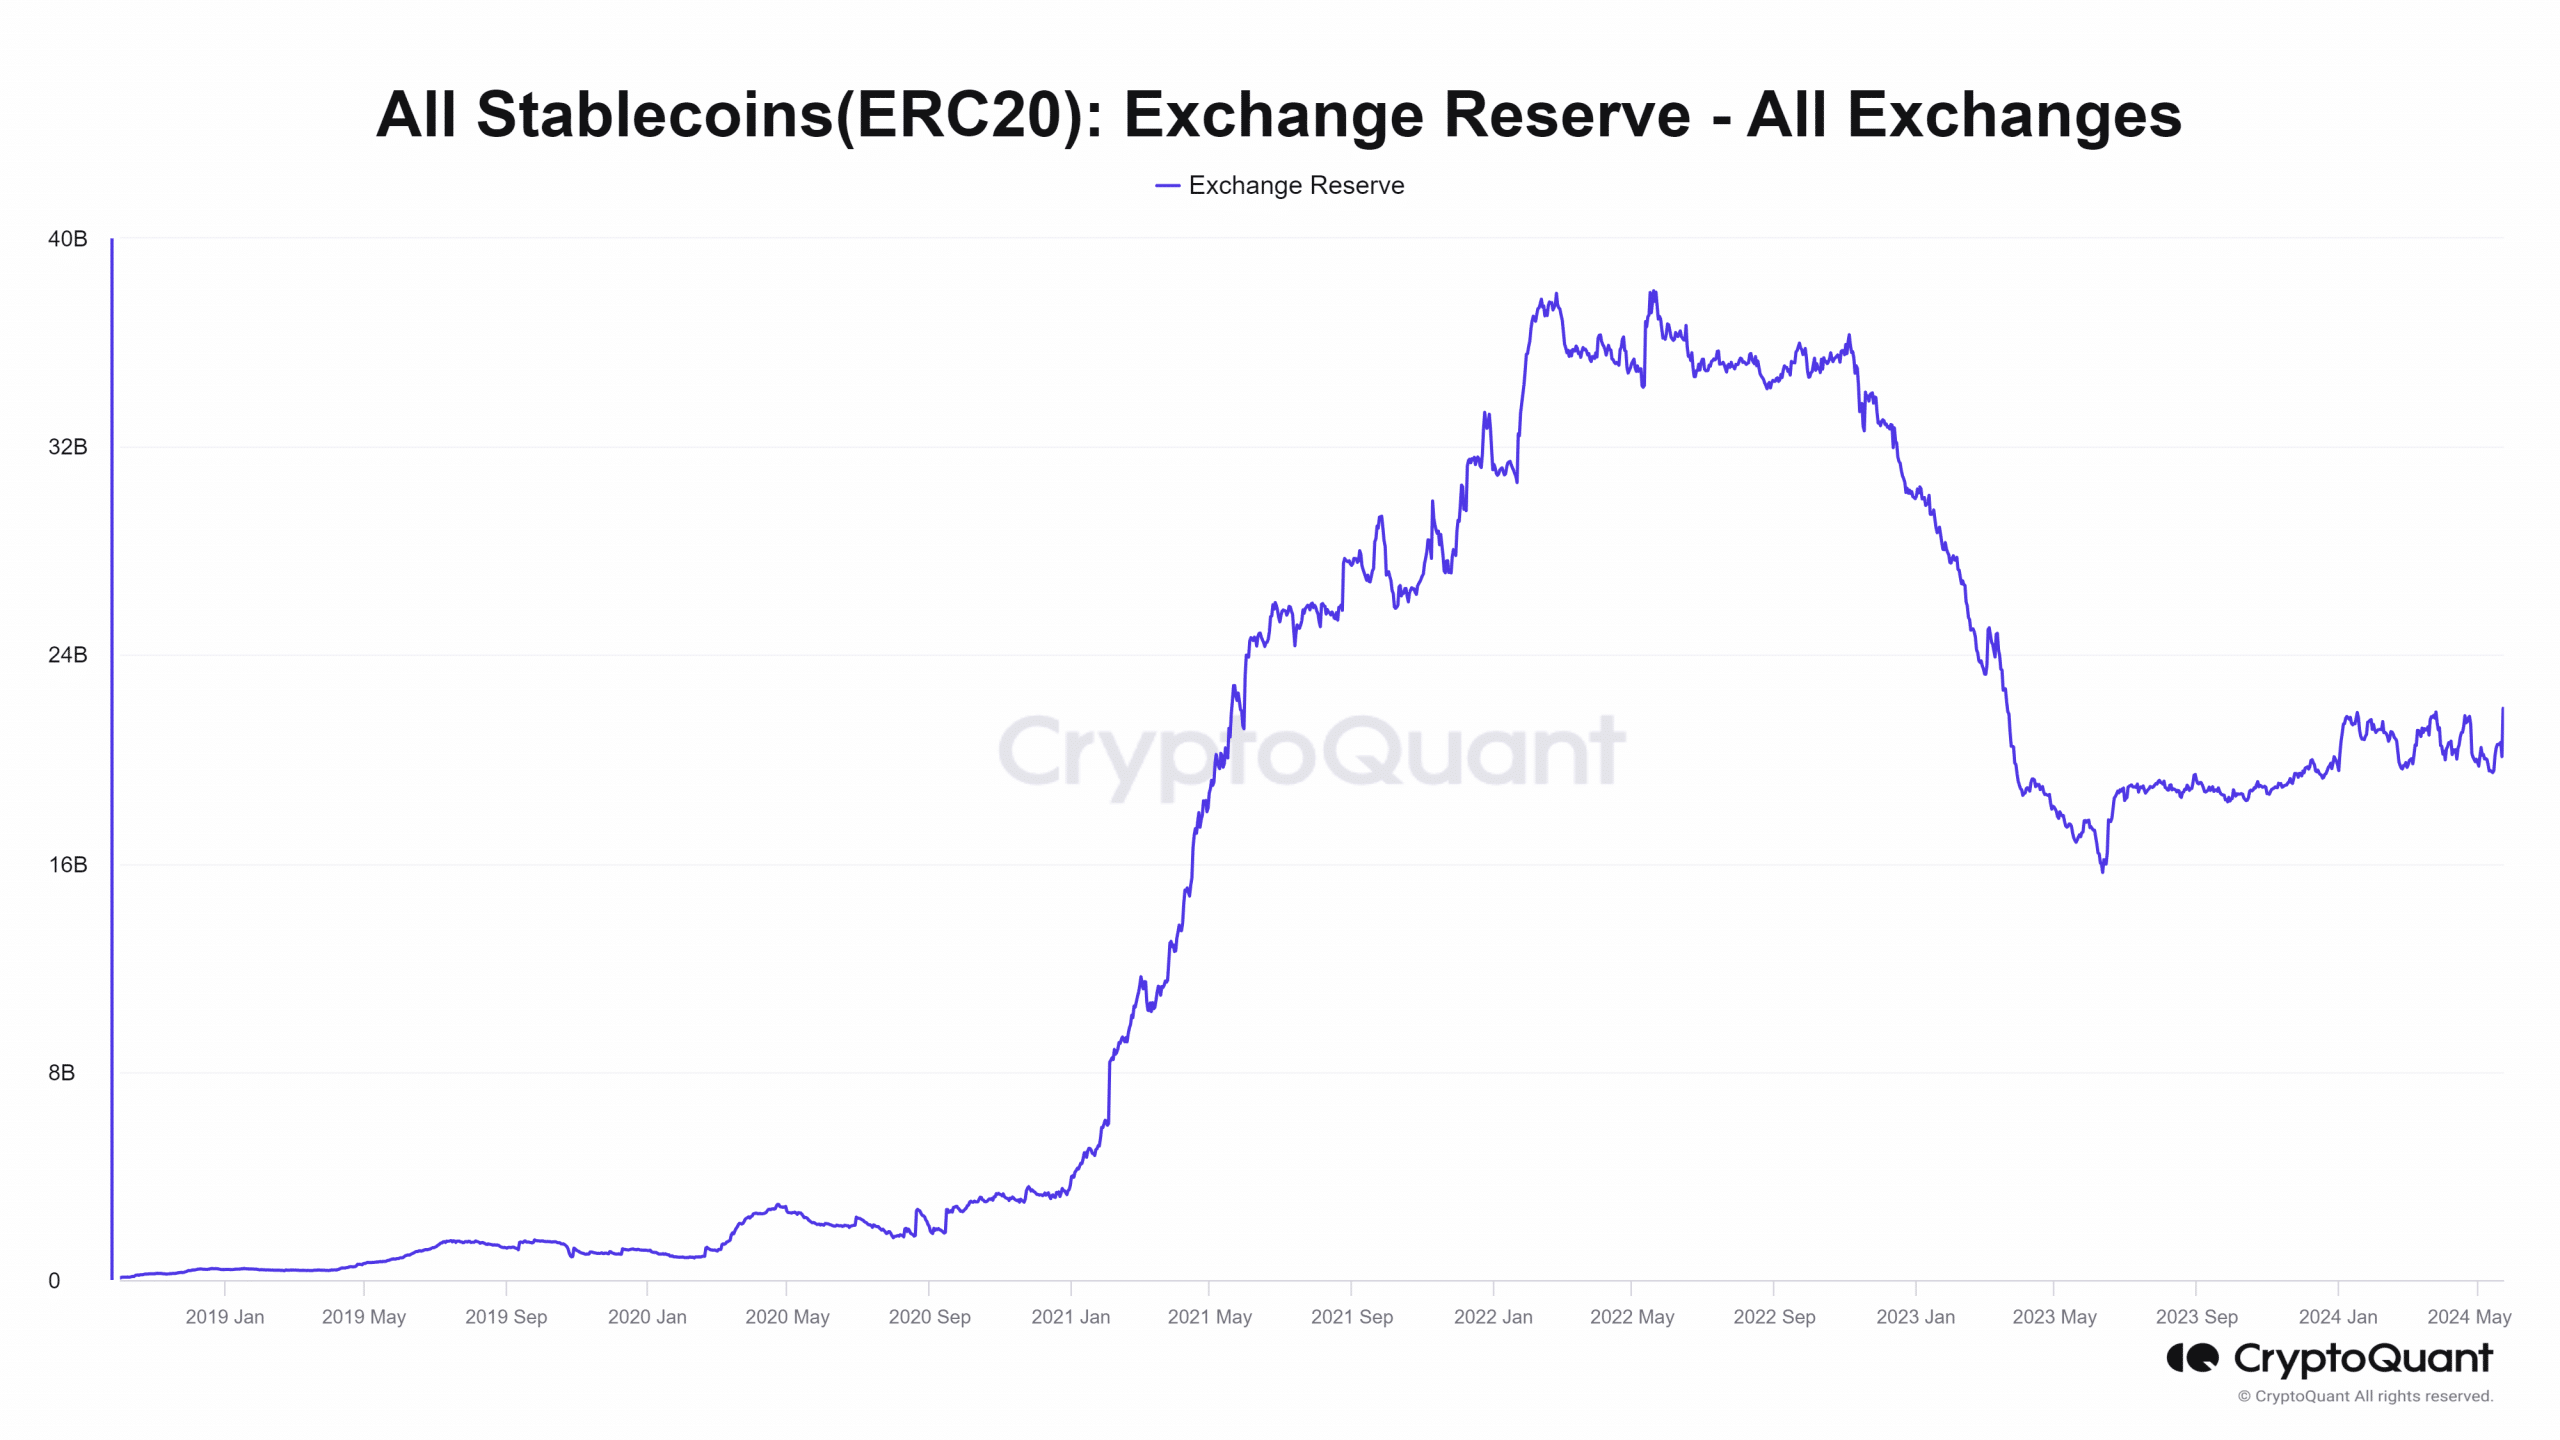
The total supply of stablecoins grew from $3.5 billion in February 2020 to $99 billion in March 2022. Since then, it declined to $67 billion due to the market contraction before beginning to climb again.
The exchange reserve mirrored the supply and has slowly climbed in the past 12 months. This might need to start accelerating to replicate the previous bull run and keep pace with the next rapid growth cycle in the crypto market cap, if that scenario unfolds.
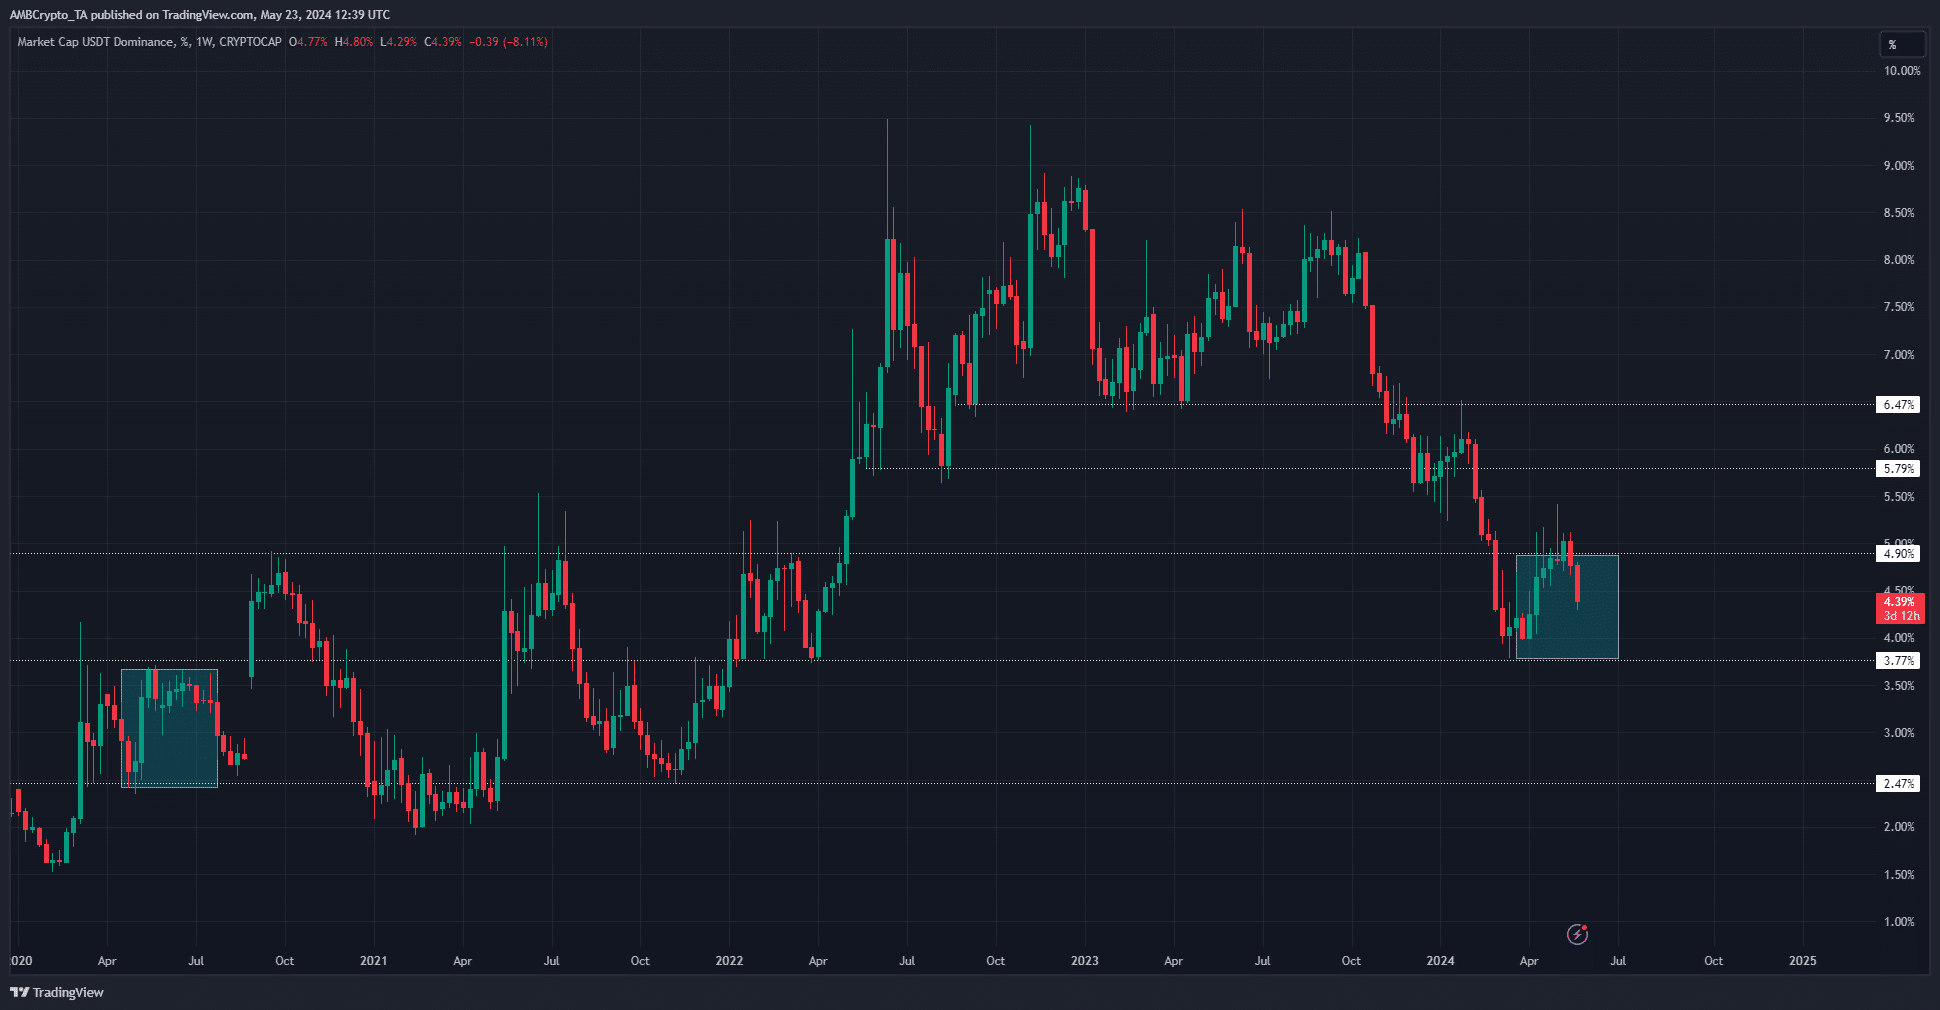
The Tether dominance chart showed some similarities from the previous halving. Highlighted by the cyan box, the past halving saw the dominance fall for just over two months after the event before shooting higher in August 2020.
Is your portfolio green? Check the Bitcoin Profit Calculator
A falling USDT dominance implies bullish price action across the crypto market, and a rising dominance indicates investors fleeing to the stablecoin and bearish pressure in the market.
If the similarities extend, we might see a sharp drop across the crypto market early July, just over six weeks later.


