
$64.4M Bitcoin sale stirs fear of short-term BTC price dip – Explained

Disclaimer: The findings of the following analysis are the sole opinions of the writer and should not be considered investment advice
In November 2021, news came out that the U.S Consumer Price Index (CPI) rose by 6.8% when compared to the year prior. This signalled that inflation was higher than expected. Smart market participants asked a pertinent question – Could this inflation result in investors fleeing cryptocurrencies, which are inherently risky holdings?
Well, a look at Tether Dominance in the market showed that it stood at 4.7%, at the time of writing. This means that money is on the sidelines and either waiting to be deployed or waiting to ride these stormy conditions out.
Could $34k prices for Bitcoin prompt this deployment, or are we in for more pain?
BTC- 1 day chart
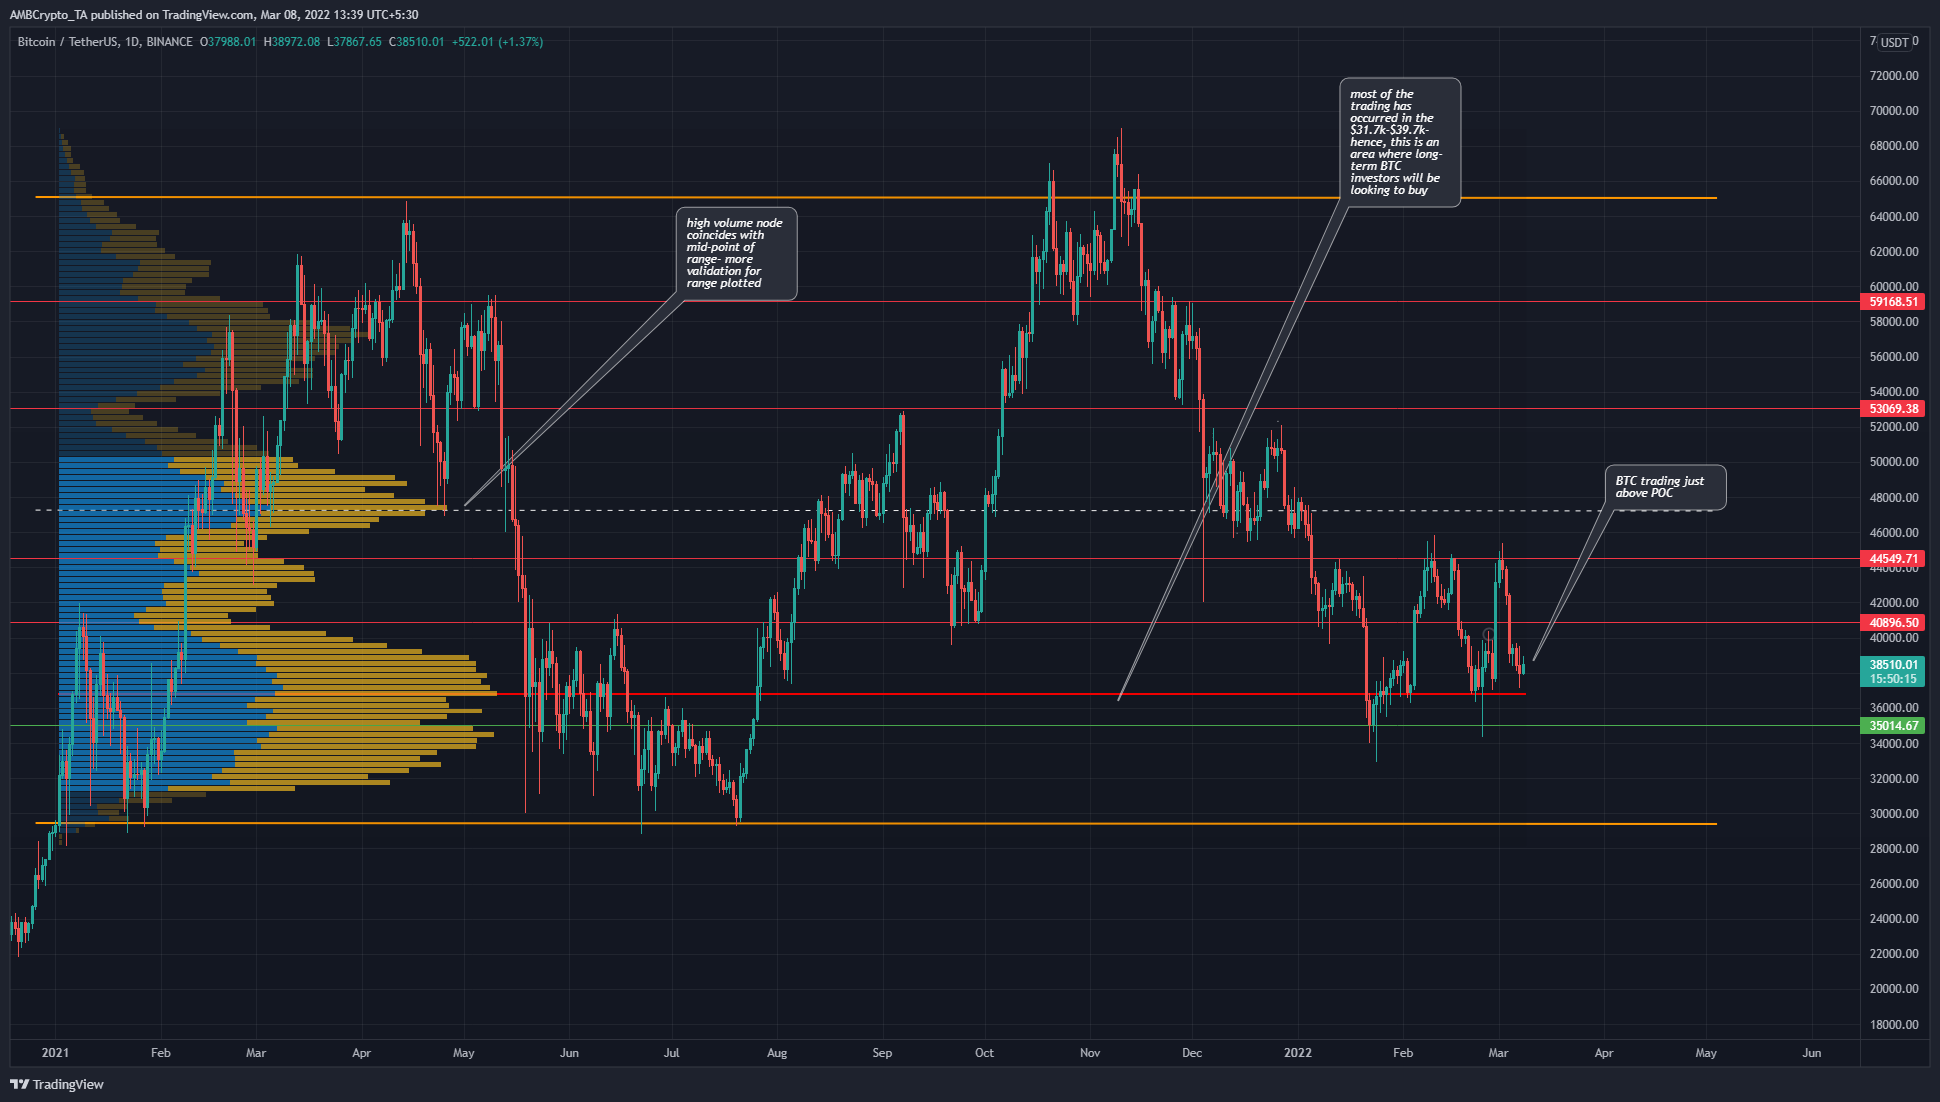
Source: BTC/USDT on TradingView
Invasion by Russia, inflation, energy shortage, possible drop in wheat exports, and more factors plague the long-term investor. Especially ones who believe that Bitcoin is digital gold. For these investors, buying Bitcoin in times of crisis seems obvious, but what does the rest of the market think?
On grounds of technical analysis alone, the price has traded within the range from $29.4k to $65.1k since early in 2021. The Fixed Range Volume Profile showed that the area from $31.7k to $39.7k has been heavily bid, and would likely be an area where BTC finds demand in the weeks to come.
However, the trend has been bearish over the past four months. A move to $30k cannot be ruled out. To the north, resistance lay stiff at $44.5k and $52-$53k area. To the south, the Point of Control was at $36.8k.
Rationale
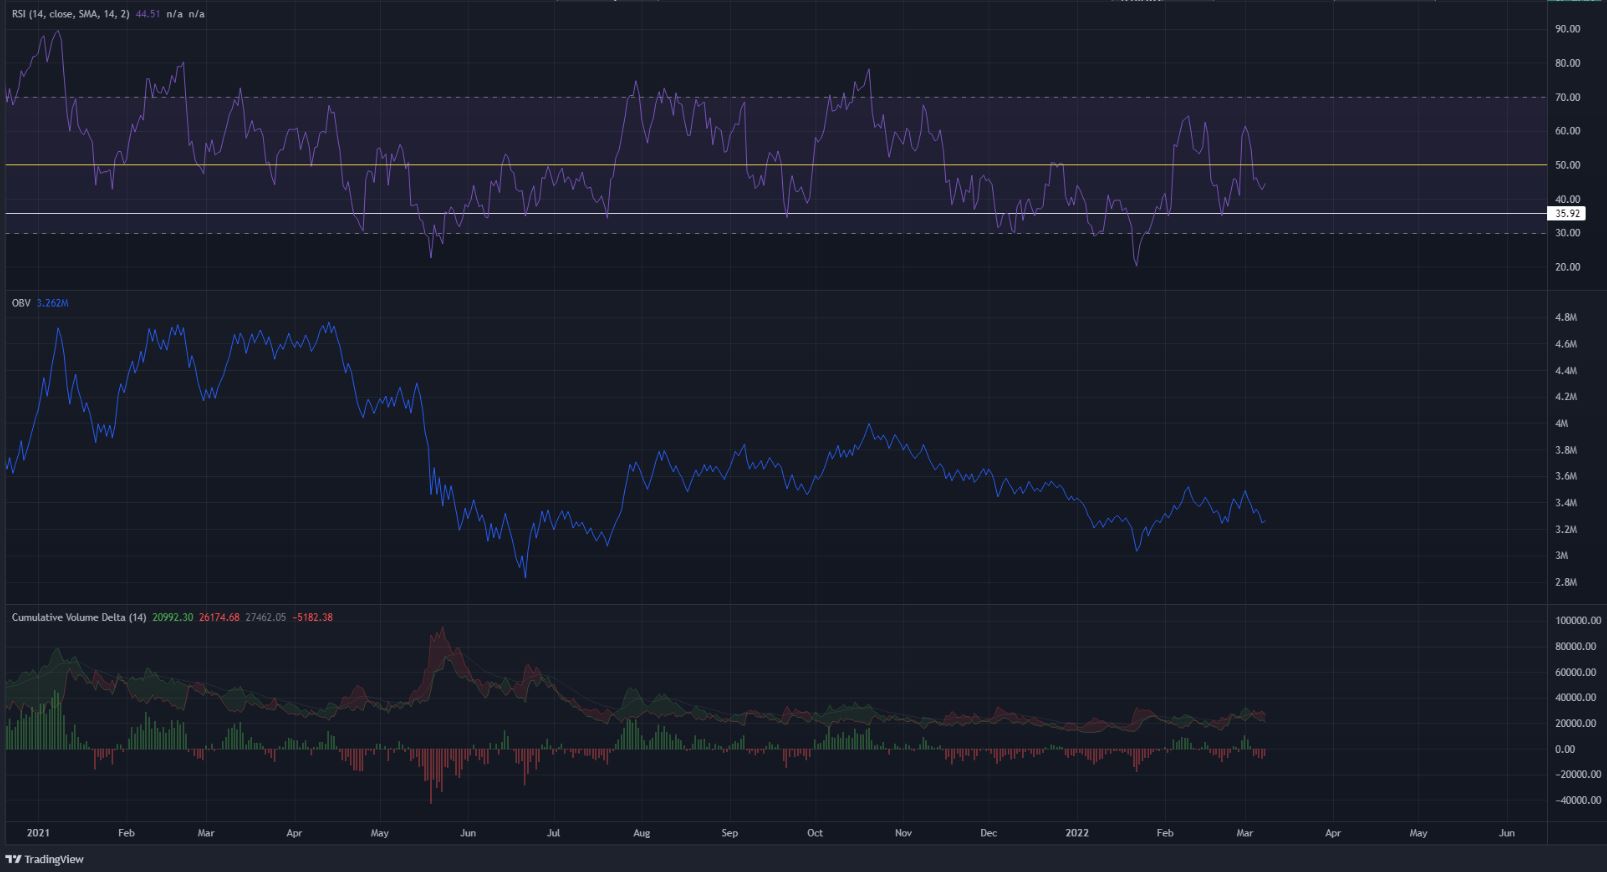
Source: BTC/USDT on TradingView
The RSI has not dropped under 35.9 and a sharp dip beneath this level on the daily chart could see losses for BTC. However, over the long-term, such a drop would represent bargain buying opportunities.
The OBV has been moving sideways since June and found a local top in early November when BTC reached $68k. At the time of writing, the CVD was in bear territory.
Conclusion
There weren’t many signs of a shift in the trend towards bullish. The market structure has been bearish in recent months, although a range could have been established between $36.8k-$44.5k on lower timeframes.
The $36k area offered good support while $44.5k and $47.1k remain levels to beat to initiate a bullish trend for Bitcoin. However, Bitcoin leaving exchanges is not as great as it was at the start of the previous bull run. This could mean further downside for BTC before demand from smart money arrives.


