What this metric tells us about if Bitcoin’s correction phase is here to stay

After managing to excite the whole community by breaking past its critical resistance level, Bitcoin’s price has, yet again, subjected itself to consolidation. In fact, the king coin shed more than 2.2% of its value in the last 24 hours alone.
Will the downtrend prolong itself?
Well, miners are an integral part of the HODLer community. Whenever they’ve sold their HODLings, BTC’s price has sunk more or less. Hence, analyzing their current state would help in deciphering the answer to the aforementioned question.
For the first time since mid-May, Bitcoin’s Puell Multiple reading reflected a value of more than 2 [2.02, to be precise] on 23 August. Traditionally, when this metric inches higher, the odds of miners selling their HODLings intensify.
Here, it’s worth noting, however, that the same had fallen to 1.54 at the time of writing. Simply put, the latest reading seemed to invalidate the aforementioned narrative.

The Mayer Multiple indicates…
The Mayer Multiple (MM) was created to analyze BTC’s price with respect to its previous movements. Whenever investors have invested in Bitcoin at any multiple below 2.4, it has fetched them fairly high gains. At the time of writing, this metric had a value of 1.04.
In the past, whenever BTC’s price has rallied, the MM’s reading has always been above 1.5. Hence, looking at the current state, it can be said that there’s still some time left for the rally to re-commence.
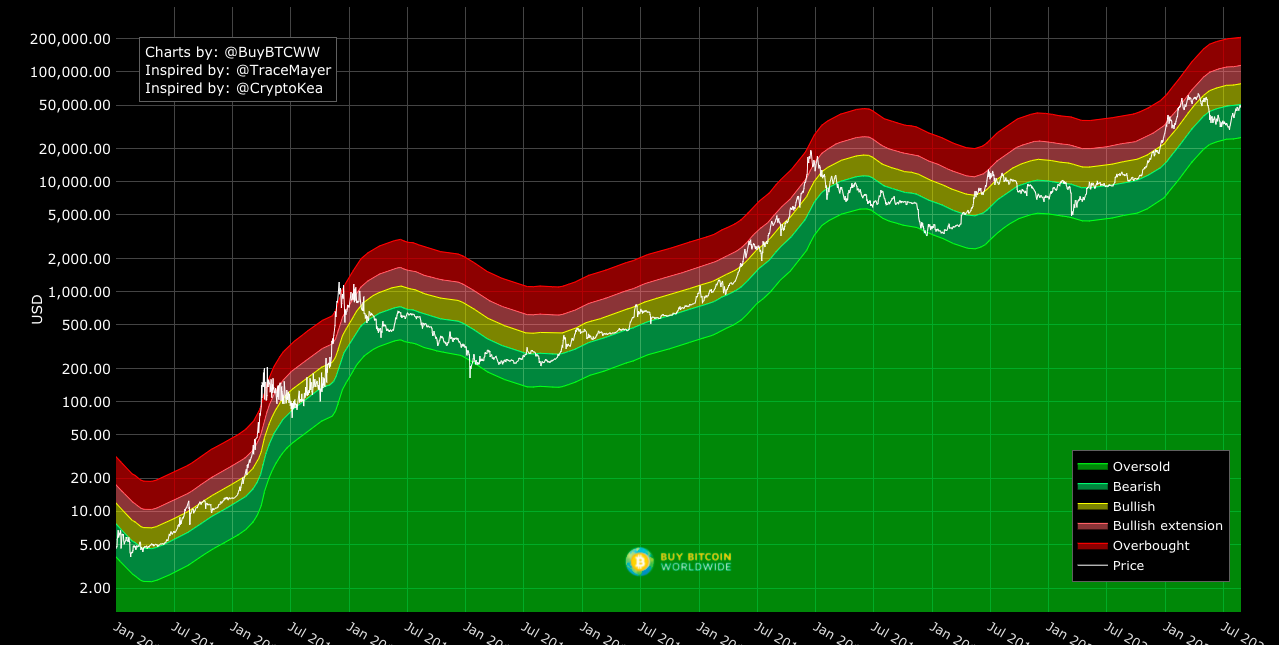
Furthermore, as far as trend reversibility is concerned, peeking into the Mayer Multiple Bands would give a better understanding. From the chart attached below, it can be observed that Bitcoin’s price is currently situated in the bearish band. Notably, it did make an attempt to step into the bullish zone a few days ago but was rejected.
Nonetheless, whenever BTC has dropped below the bearish range in the past, it has more often than not bounced back. Hence, at this stage, it can be said that the macro-bull run narrative still holds true. Even so, the on-going consolidation phase might end up slightly prolonging itself.
The missing puzzle piece
Bitcoin’s price has not really covered a lot of distance on its price chart of late. In fact, since 9 August, it has only been oscillating in the $46k-$50k bracket. To make things worse, the daily candle in the making, at the time of writing, was bearish. In retrospect, the strength of the $49.9k and $51.5k resistance levels seemed to further intensify.
Notable major rallies have, more often than not, been led by whales in the past. However, the whale concentration this time around seems to be fairly low. In fact, Santiment’s data showed that the number of whales, and sharks for that matter, have not risen significantly over the past two months.
The number of market participants who HODL 10-10k BTC have merely increased by 160 while the number HODLing more than 10k BTC has risen by only 2. Thus, for Bitcoin’s price to rally from its current stagnated zone, whales need to step up and do some heavy lifting.


