What traders must know about Solana hitting its previous lows again

Disclaimer: The findings of the following analysis are the sole opinions of the writer and should not be taken as investment advice
After securing a new ATH on 9 September, Solana’s trajectory took a sharp U-turn on the charts. As investors locked in their profits, SOL’s value declined steadily below key swing supports. On closer inspection, it was observed that SOL had entered a markdown phase, one which threatened to drag the price to certain lows.
At the time of writing, SOL was trading at $164.9 and held the seventh position on CoinMarketCap.
Solana Hourly Chart
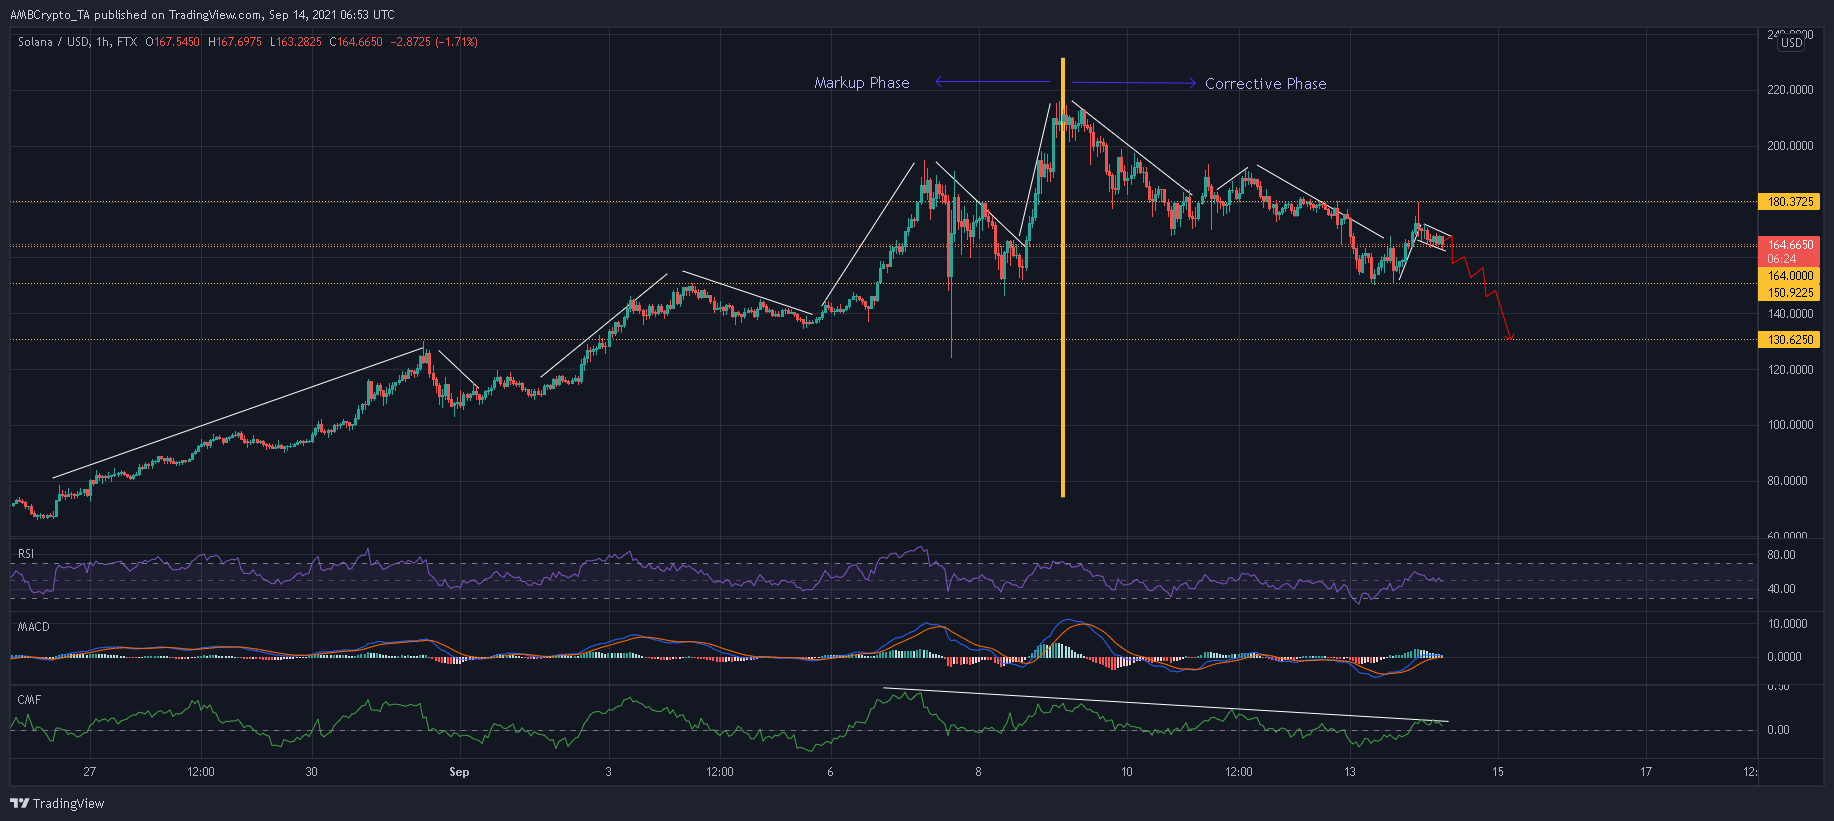
Charting SOL’s move from late August to a fresh ATH showed a steady uptrend, one which involved several impulsive waves. Naturally, higher highs and highs lows were seen during this period, which is common in a markup phase. However, this trend was overturned once SOL failed to form a fresh higher low and revisited the $151-mark.
At the time of writing, a corrective phase seemed to be active in the SOL market and some newer lows can be expected going forward. This outlook would be confirmed once SOL closes below $151 after making some minor gains. Such an outcome would see SOL decline towards the support level of $130.6. From the said level, further losses would be possible.
On the contrary, there were slight chances of a temporary hike if SOL bounces back from $164. This would lead to a breakout from a bull flag pattern and push the price towards the $180-mark.
Reasoning
Since retracing from its ATH, SOL’s hourly RSI has remained mostly bearish. The index oscillated between the mid-line and lower region – Something which is usual in a downtrend. During this period, the MACD also remained weak and below its half-line. Its histogram indicated that bullish momentum, which thrust SOL from $151-$170, was fizzling out at press time.
Moreover, the Chaikin Money Flow’s trajectory was concerning. The index has formed lower peaks since 6 September – A sign that capital was being pulled from the SOL market.
Conclusion
The last few weeks have been extremely bullish for SOL. Supported by upbeat sentiment and favorable on-chain metrics, the alt has seen a meteoric rise into the top 10.
However, a correctional phase seemed to have become active after such a sporadic rise. While it is not unusual to see some gains during this phase, SOL can be expected to revisit previous lows over the coming sessions.


