What will it take for Cardano to withstand selling pressure and hold support level

In a previous article, it was observed that Cardano showed similarities in price action in recent weeks, compared to June earlier in 2021. The Cardano charts showed that not a lot had changed. A short-term demand area was seen in the vicinity of $1.3, which has offered decent support to the price so far.
Bitcoin was at a crossroads itself, and it was unclear whether it would seek new lows or see a strong bounce toward $51k once more.
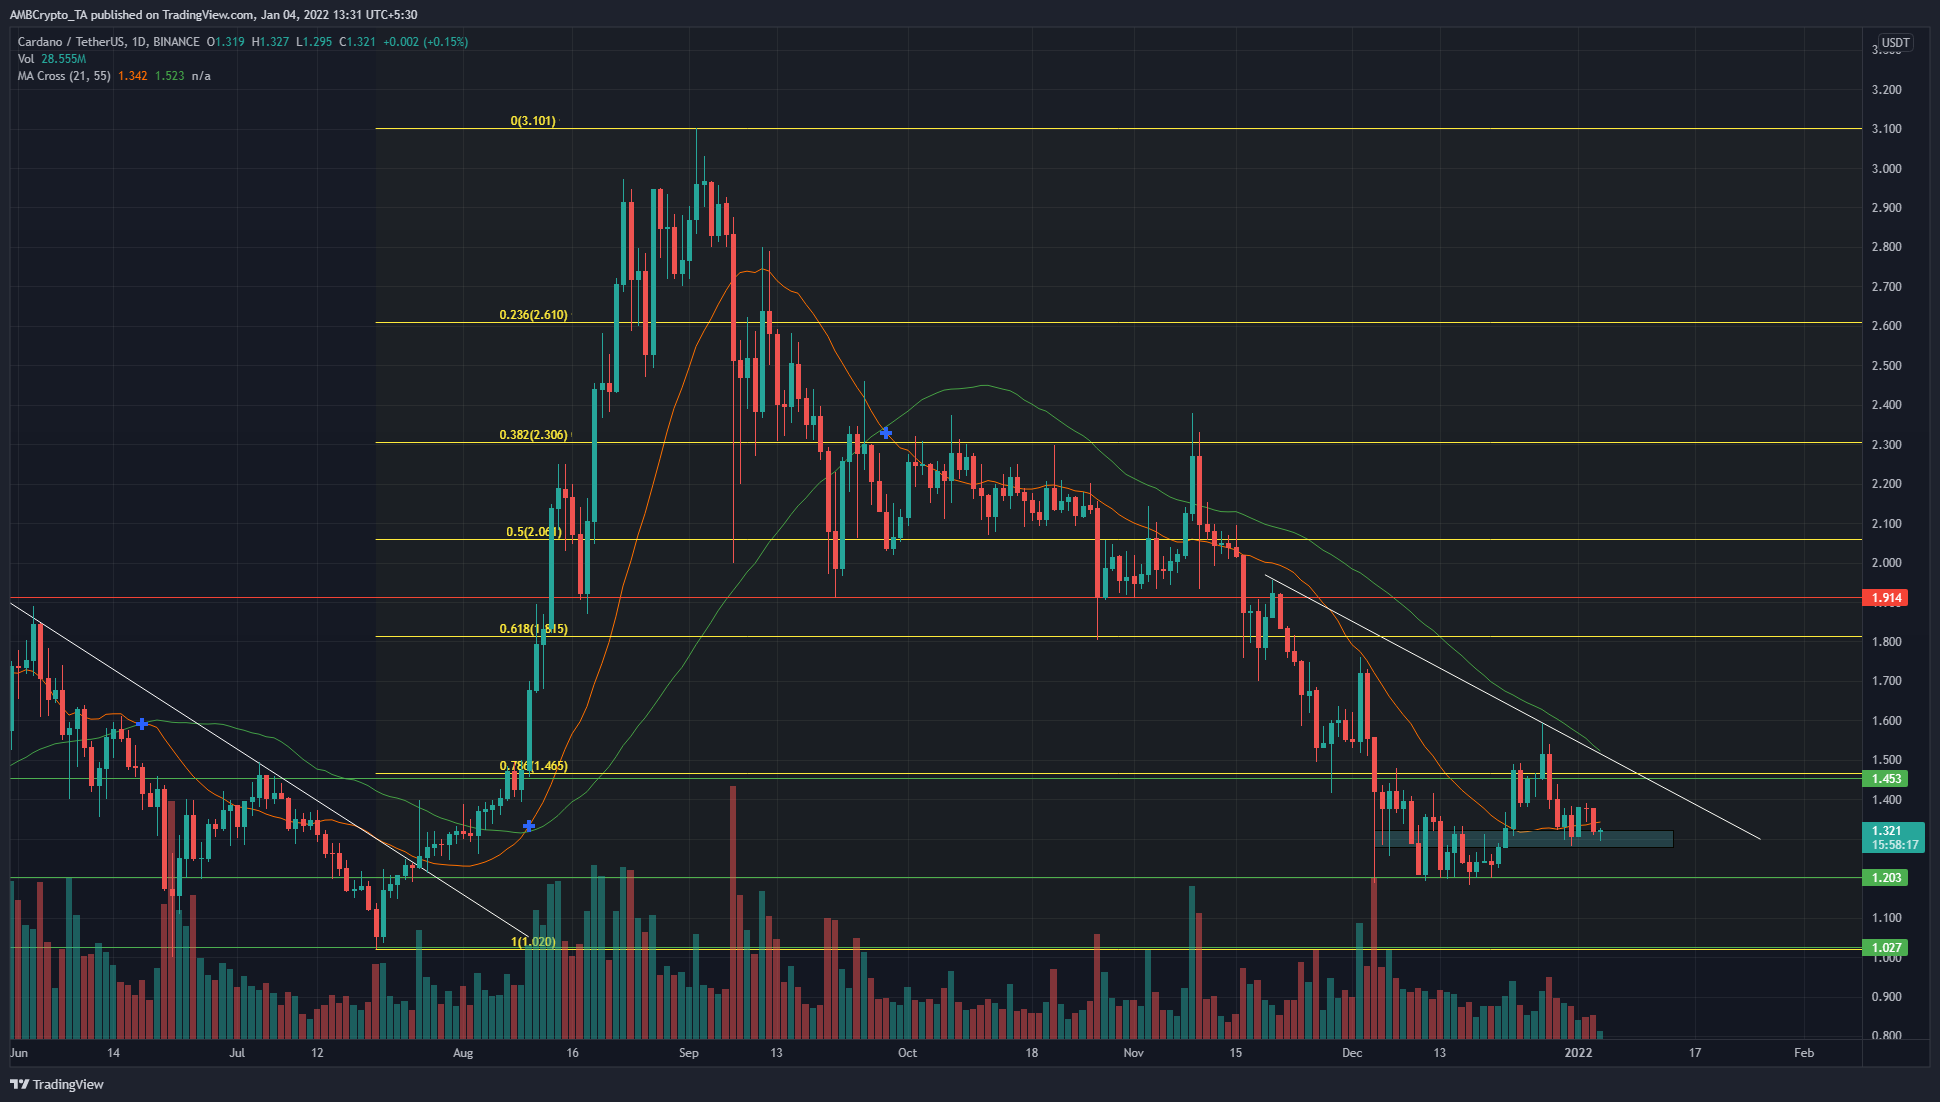
The price has been in a downtrend since the August rally to $3.1 highs. The 78.6% retracement of the drop from those heights at $1.46 has not yet been scaled. The $1.3-$1.32 area has been important and has seen some demand step in.
The $1-$1.2 area has been the strongest area of demand for the majority of the last 12 months. Hence, a dip to this area should present a good buying opportunity. However, more risk-averse buyers can wait for the $1.46 level to be flipped to support before entering a position.
The 21-period SMA (orange) was moving well below the 55-SMA (green) on the daily chart. This meant that bearish momentum was not yet undone. The trendline resistance (white) was another line to keep an eye on.
Rationale
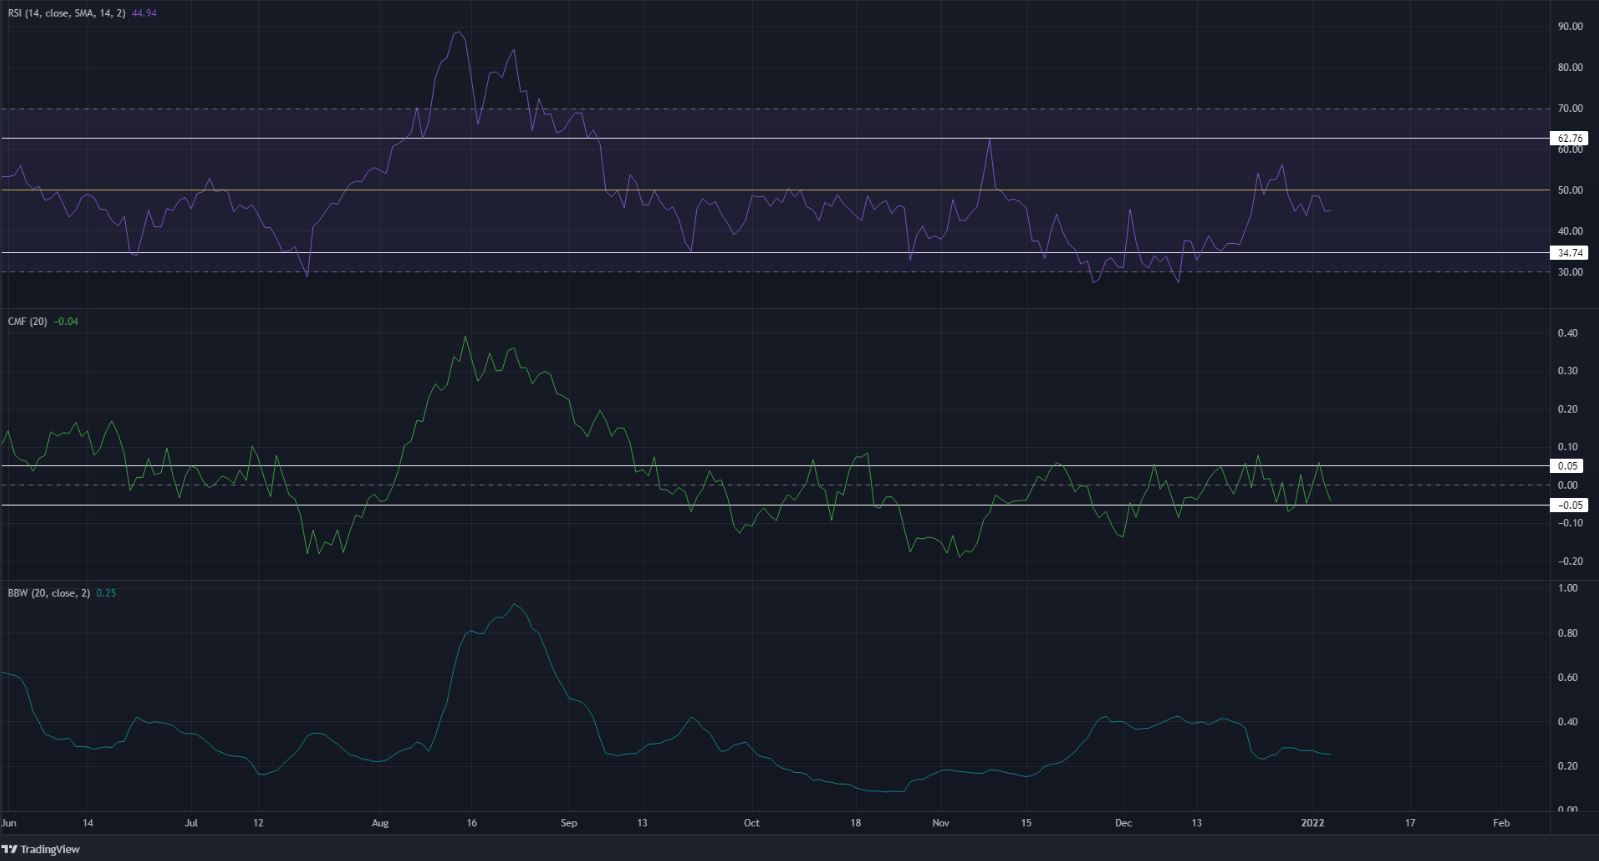
In the past, strong ADA rallies have arrived when the RSI scaled past the 62 mark. Similarly, selling pressure has also intensified on a drop below the 33-34 level. At the time of writing, the RSI on the daily was near the neutral 50 in response to the bounce from $1.3.
The Chaikin Money Flow did not show significant capital flow either into or out of the market, although it was below 0, which showed weak selling pressure.
The Bollinger bands width indicator did not near the lows it established in October when it had a month-long distribution above the $2 mark. In the coming days, if the indicator fell lower it would show ADA entering another period of consolidation. This phase would likely be an accumulation phase.
Conclusion
The price charts showed an area of significant demand, while the indicators showed neither bulls nor bears were convincingly in the driving seat in the past few days. A lack of a long-term trend can be expected to continue until the trendline resistance is broken and $1.46 flipped to support.


