Where Shiba Inu could head next after impressive five-day feat

Disclaimer: The findings of the following analysis are the sole opinions of the writer and should not be considered investment advice.
After ascending toward its three-month high on 14 august, Shiba Inu [SHIB] bears inflicted a near-term decline. As a result, the meme-coin saw a pulldown below its $0.0133-$0.0137 resistance range. (For brevity, SHIB prices are multiplied by 1000 from here on).
On the other hand, the $0.01172 baseline put the meme coin back on a bullish path as SHIB registered double-digit gains above its four-hour EMA ribbons and the 200 EMA (green). As the price action approached its immediate resistance range, SHIB could observe a sluggish phase.
If the buyers defend the $0.0129-support, SHIB could see a rebound. At press time, SHIB traded at $0.01306.
SHIB 4-hour Chart
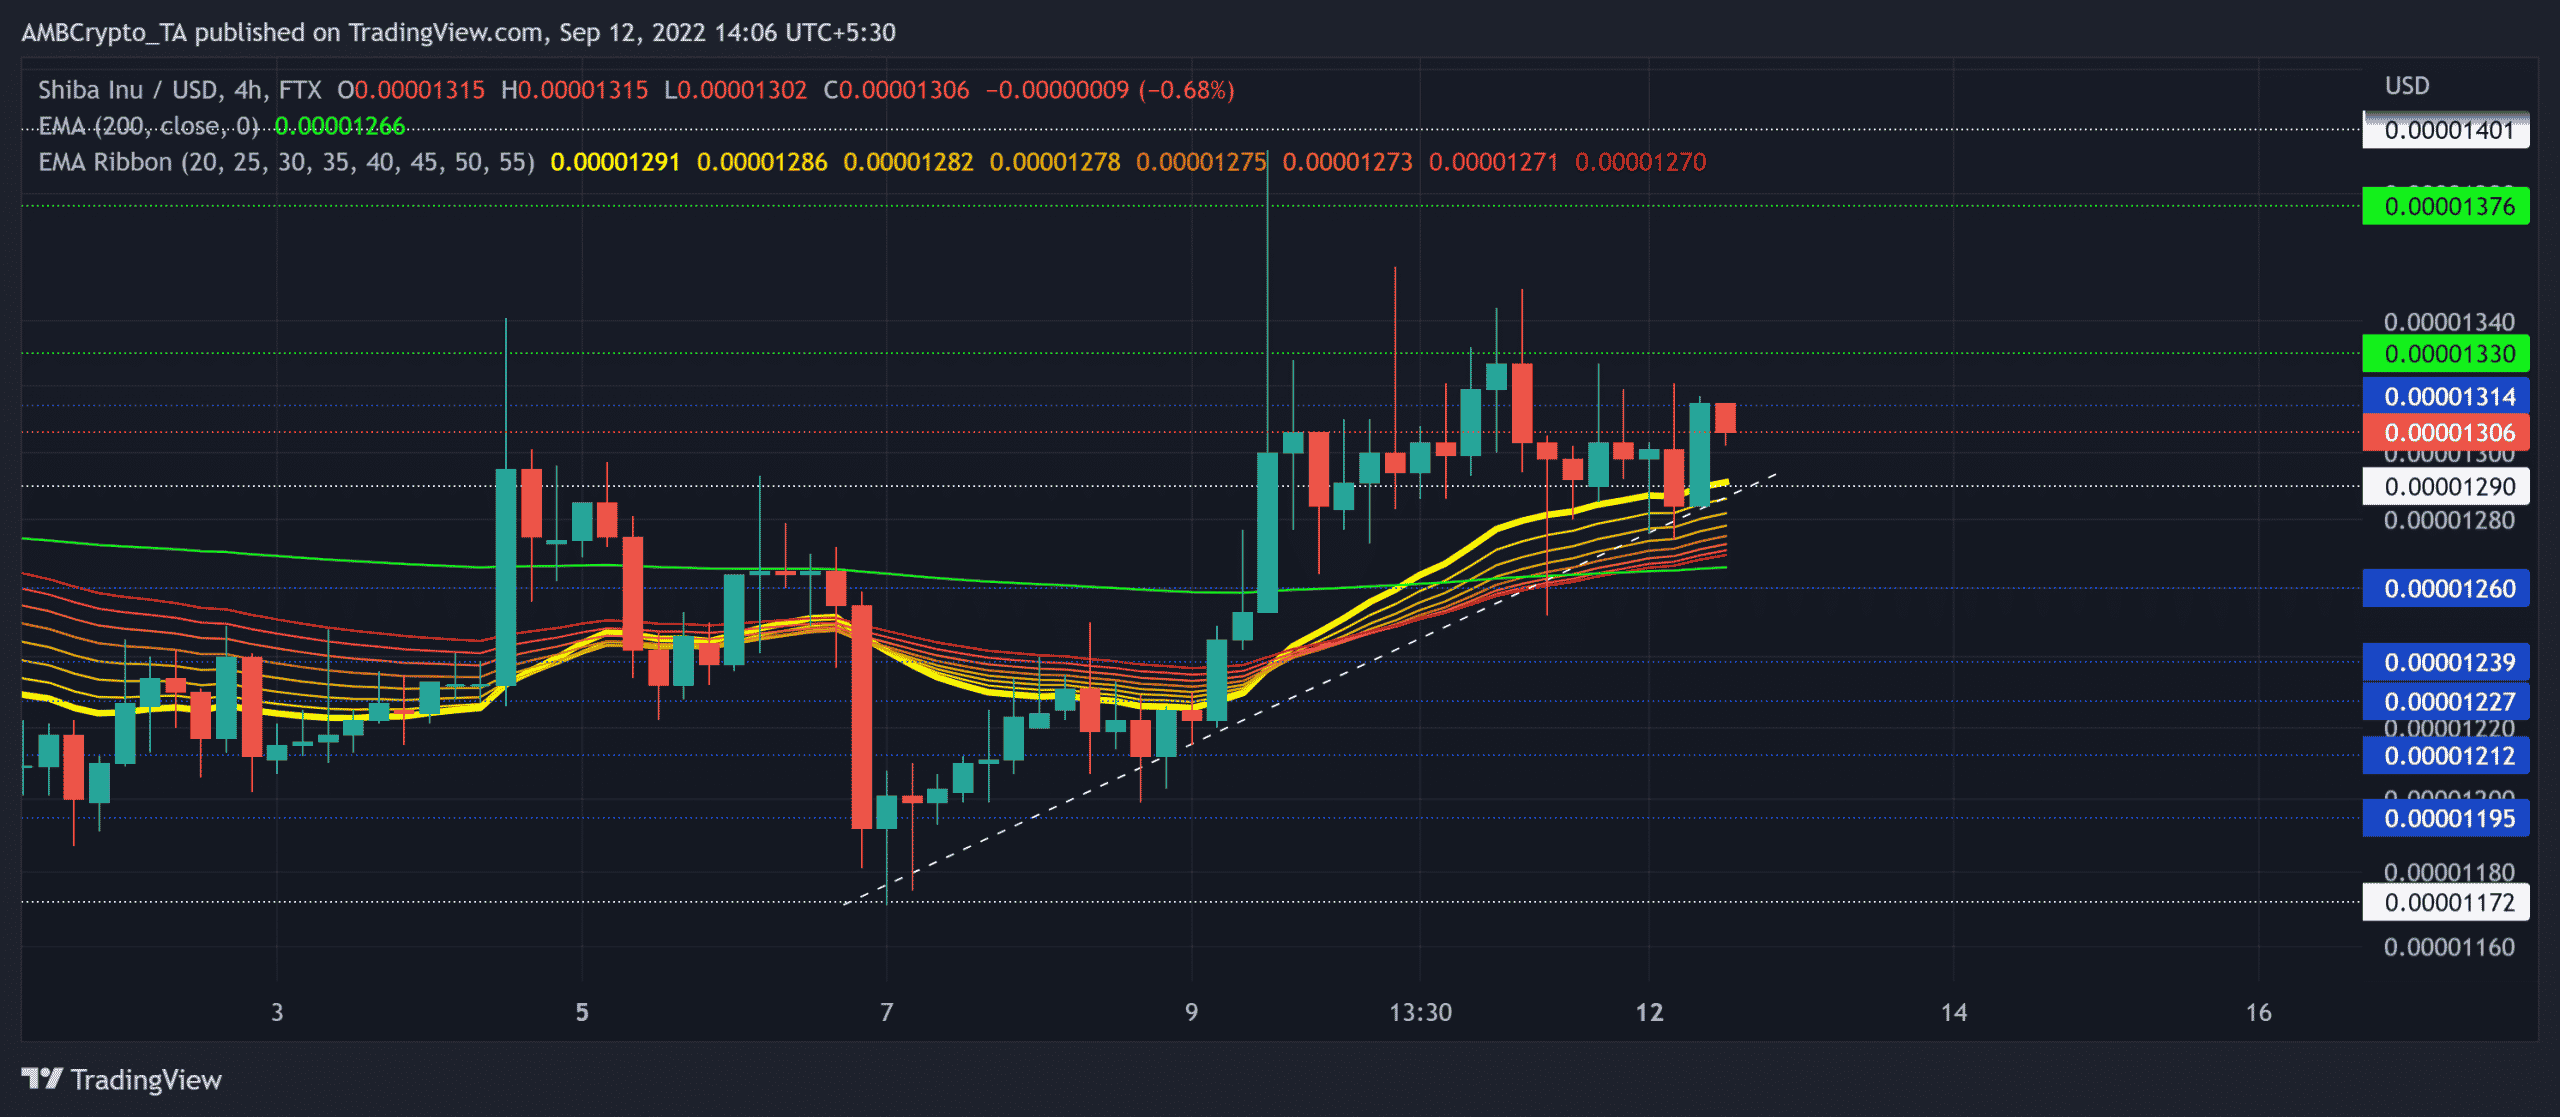
Over the last week, SHIB’s ascent chalked out northbound trendline support (white, dashed). This growth led SHIB to retest the $0.0133 resistance as it seemed to slow down.
In the meantime, the EMA ribbons undertook a full bullish flip after nearly three weeks. Also, the 20/50 EMAs close above the 200 EMA has reaffirmed the bullish vigor in the SHIB market.
A decline toward the $0.0129-level could likely propel a rebound. In this case, the coin would retest the $0.0133 resistance before committing itself to a trend.
An immediate or eventual close above the $0.0129-mark can expose the coin toward an upside. In such circumstances, SHIB could witness a recovery toward its EMAs in the $0.0137-$0.014 range.
An inability to find a close above the $0.0133 mark support would encourage a slow-moving phase compression phase in the coming sessions.
Rationale

The Relative Strength Index (RSI) was gradually declining after reversing from the overbought region. But the index still maintained its position above the midline to depict a slight bullish edge.
Also, the DMI lines resonated with a slight bullish edge in the market. To top this off, the ADX revealed a strong directional trend.
However, the Chaikin Money Flow (CMF) was yet to undergo some improvements. Its decline below the zero mark has exhibited a slight preference for the sellers.
Conclusion
Given the influxion of the $0.0129-baseline and the 20 EMA, SHIB buyers would aim for a rebound from its immediate support. But they must topple the $0.0133 resistance to confirm the bullish bias. The targets would remain the same as discussed.
Also, the alt shares a 95% 30-day correlation with Bitcoin. Thus, keeping an eye on Bitcoin’s movement with the overall market sentiment could be supplemental to identify any bullish invalidations.


