Why Bitcoin Cash bulls must be wary of this outcome
Disclaimer: The findings of the following analysis are the sole opinions of the writer and should not be taken as investment advice
Once a regular in the top 10, Bitcoin Cash, at press time, had slipped down the pecking order. Its year-to-date gains of 42% looked pale when compared to most of its counterparts while its ranking dropped to the 12th position. On the charts, its most recent rally came in the form of a 40% hike from its 22nd June low of $387.33 but it was unable to topple the $540 price ceiling.
A correctional period over the past few days dragged BCH towards its 23 May swing low of $467.8 and the threat of a breakdown loomed large. At the time of writing, BCH was being traded at $468.5, down by 1.8% over the last 24 hours.
Bitcoin Cash 4-hour chart
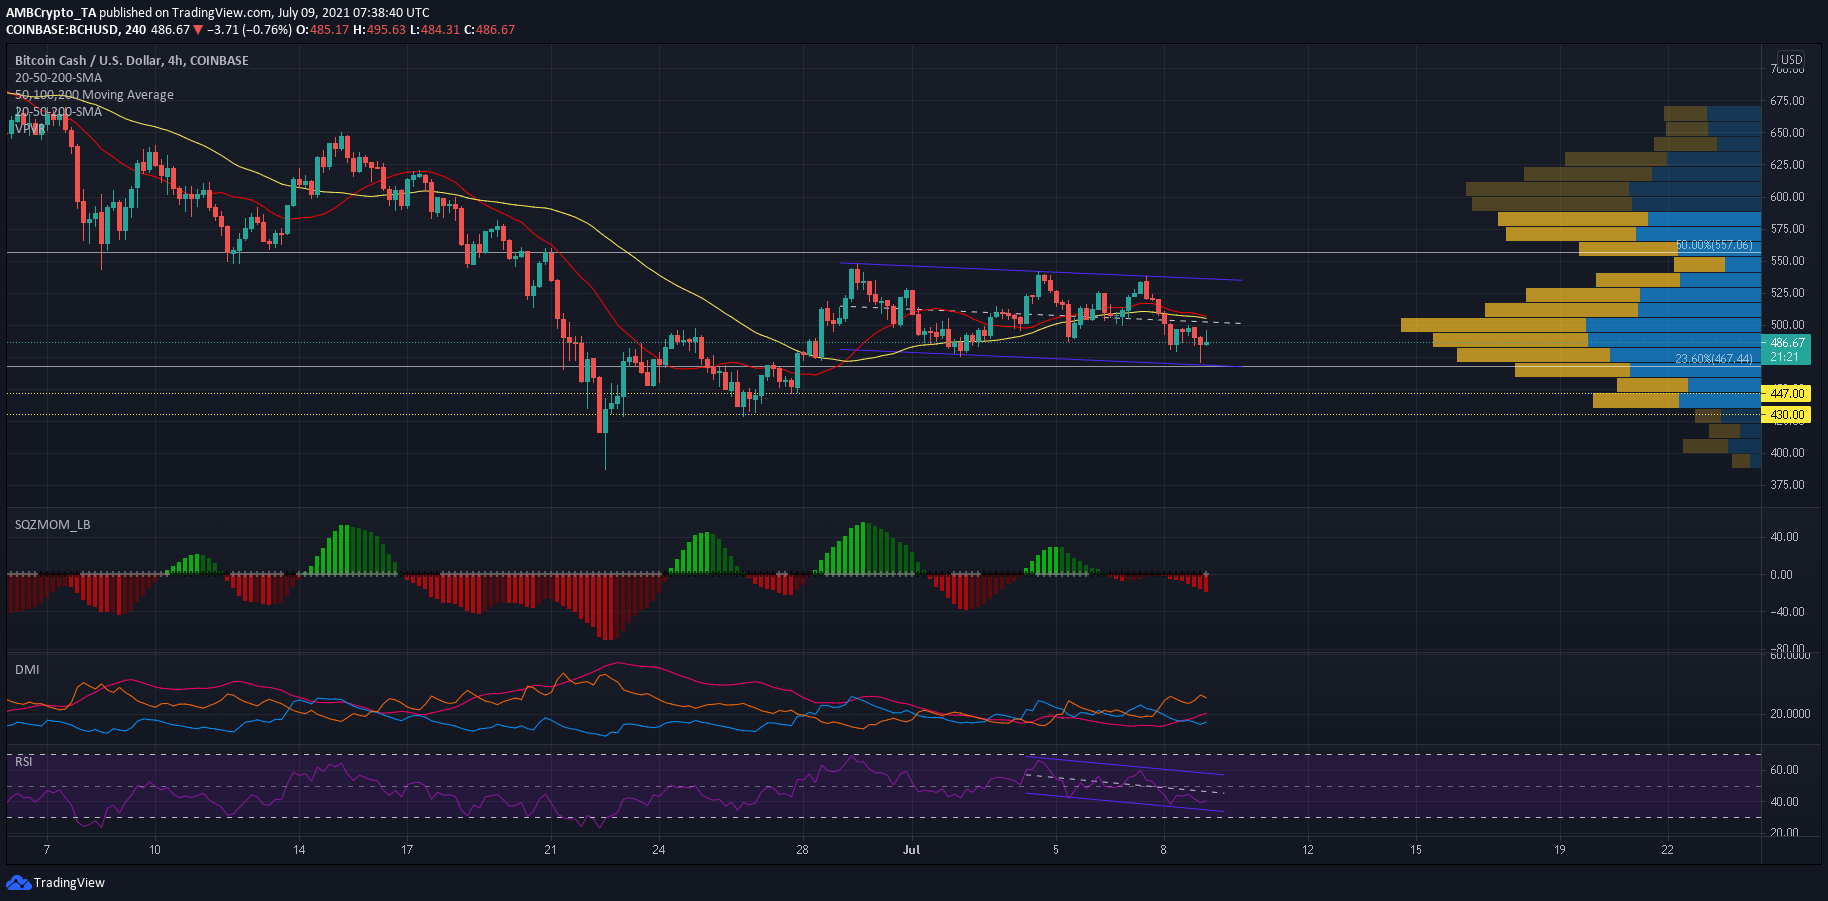
BCH formed a near 5-month low once the price fell as low as $387.3 on 22 June. Buyers finally returned to the market at the aforementioned price level but were unable to push BCH beyond its 50% Fibonacci Extension ($557) despite several attempts over the past week and a half. A wider correction eventually slipped into the BCH market as prices moved below their 20 (red) and 50 (yellow) simple moving average lines.
The 23.6% Fibonacci extension rested at the 23 May swing low of $467.4 as a move below this zone could drag the price to its first defensive line of $447. Further below the charts rested another support level of $430.
Reasoning
The Squeeze Momentum Indicator noted the buildup of bearish momentum and if volatility picks up, as suggested by the white dots, steeper losses can be expected over the coming sessions. The Directional Movement Index saw a trend shift on 7 July as the -DI line moved above the +DI. Since then, the bears have been in control, although the two lines did converge at press time. The Relative Strength Index was in bearish territory and within the confines of a down-channel.
Although the bears were in control at press time, the Visible Range noted a lot of interest for BCH between the price range of $470-$500. If market bulls manage to cushion losses at the 23.6% extension level, BCH could see a period of consolidation before a stronger trend emerges in the broader market.
Conclusion
Despite losses seen over the past few days, the bulls were in with a chance of stopping losses at the 23.6% Fibonacci extension of $467.4. However, short trades can be set up if BCH penetrates this defense and moves closer towards its next support lines of $447 and $430.