Chainlink, Ethereum Classic, Zcash Price Analysis: 09 July

Although Bitcoin’s market was recovering from yesterday’s fall at press time, some altcoins were seeing a lot of selling pressure on the charts. Chainlink [LINK] was among the altcoins still trending lower in the long term, with the likes of Ethereum Classic and Zcash noting some variance as well.
Chainlink [LINK]
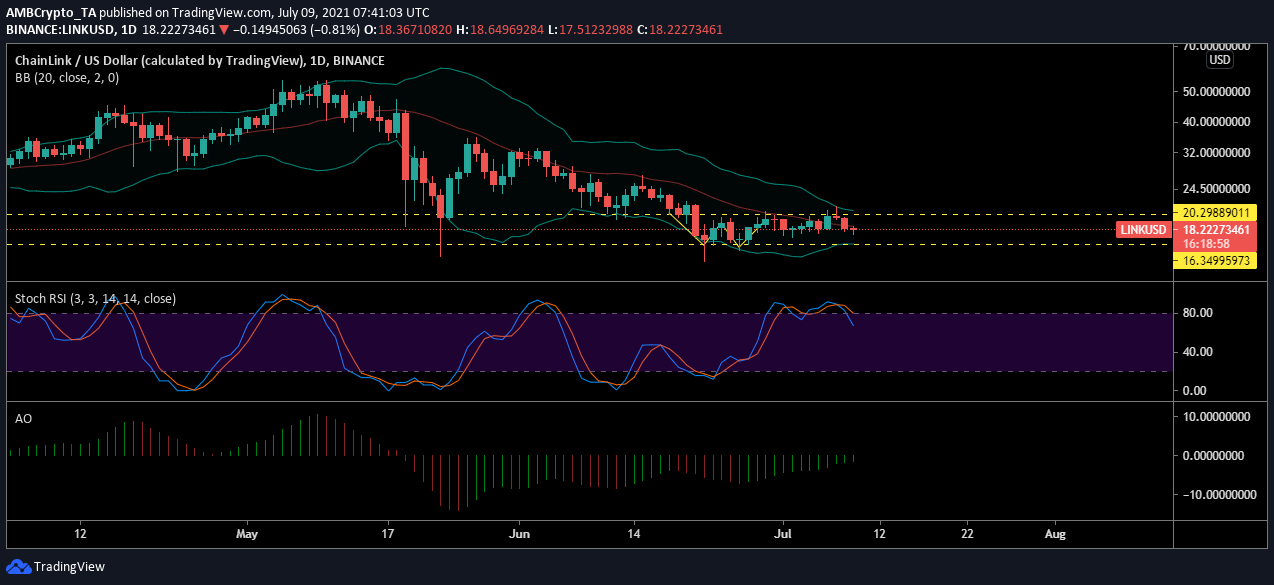
The daily chart for Chainlink noted consolidation between $16.34 and $20.29. The asset was bouncing within this range and rejected the resistance at $20.29 for the third time.
At the time of press, LINK was trading at $17.89, a level that acted as local support within the aforementioned range. The price may find some balance and momentum here to push for an upwards breakout.
Alas, the press time market remained bearish with low volatility. The Bollinger Bands were converging on the charts and underlined low price movement. Additionally, the hike in selling pressure fueled a drop from the overbought zone.
The Stochastic RSI remained in the overbought zone for most of July, but it plunged as the sell-off commenced. The asset remained close to the overbought zone, however, a finding which meant that the buyers had not let go of LINK.
Ethereum Classic [ETC]
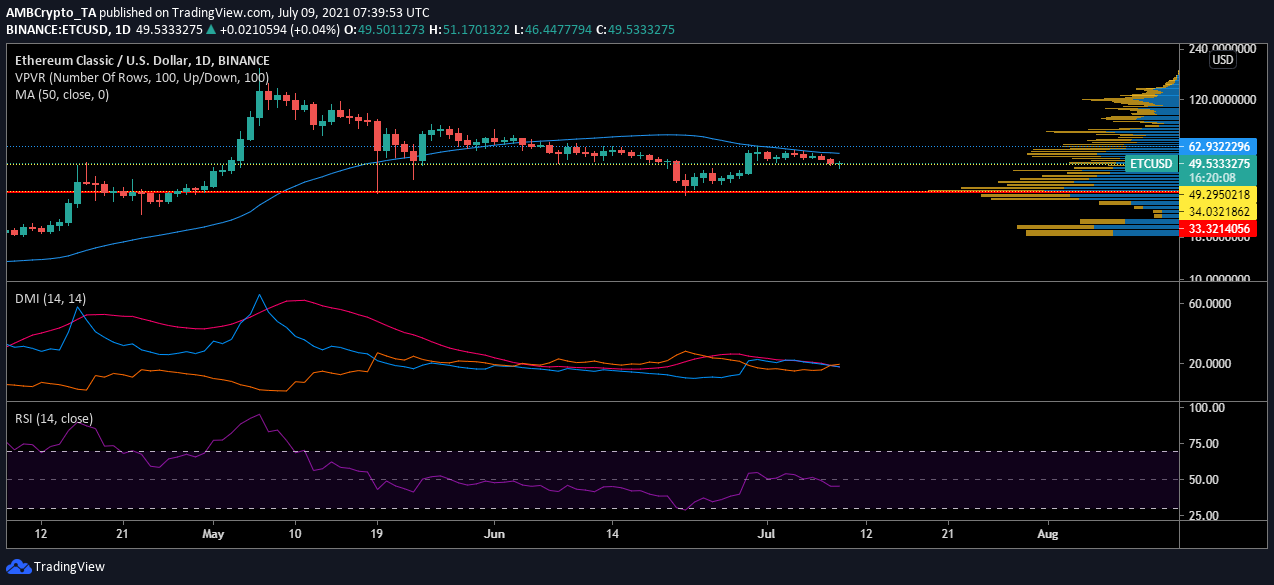
Ethereum Classic’s chart highlighted that the Point of Control [Red line] was at $33.32 over the prevailing period. This meant that the traders were actively trading at the abovementioned level. This level could act as a support for the price trading at $49. However, this was a $16 difference in price.
The Visible Range suggested that ETC was not highly traded above $50. Thus, in case of a price fall, ETC could drop close to the support. The press time price was treading another level of support at $49. The price could be at an inflection point – Either buyers or sellers could trigger another price swing.
Since the market sentiment has remained fearful, the bears seemed to be at an advantage. The Directional Movement Index pointed to rising downward pressure as the -DI surpassed the +DI. Nevertheless, the trend was not strong enough to continue.
Meanwhile, the RSI remained close to equilibrium and suggested that the buyers were not letting go easy.
Zcash [ZEC]
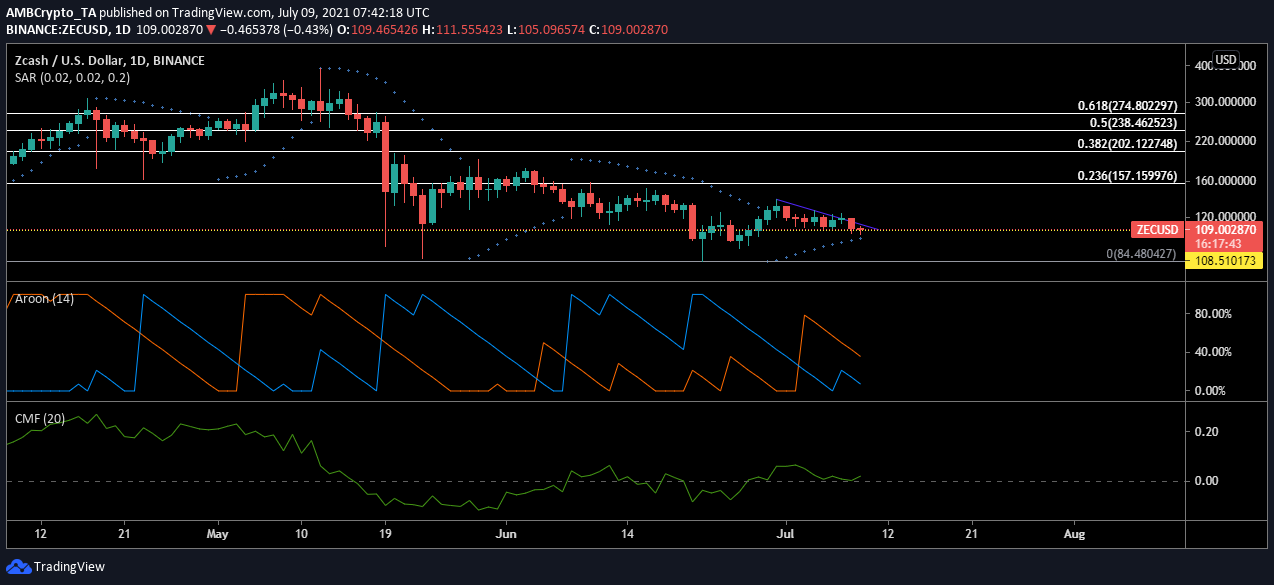
Zcash’s price dropped under the support level at $108.51, with the alt trading at $107.46. The crypto’s price dropped within a descending triangle, one which could lead to further fall on the charts. Unlike most altcoins in the market, ZEC’s charts noted some bullish sentiments.
The markers of the Parabolic SAR aligned under the candlesticks – A sign of a rising price trend. Meanwhile, the Aroon Up line remained above the down line, underlining the bearish winds in the market. Despite the market remaining in money, the tides were changing.
This bullishness was escaping the market as the markers closed in with the candlesticks and the Up line was reaching a point of potential crossover. Traders may want to remain alert. Capital inflows remained greater than capital outflows too.