Why Bitcoin longs are seeing liquidations
There is a high chance that Bitcoin might slip into bearish territory with the current price trend.

- Bitcoin’s Funding Rate has continued to decline.
- BTC has seen waning fortunes as well, as it dropped off the $42,000 price range.
Recently, Bitcoin [BTC] fell below the $42,000 price range, and there is a possibility of further descent if the current downward trend persists. The price decrease has led to a decline in trader sentiment and an increase in long liquidations.
Bitcoin price falls from two key positions
Over the last two days, Bitcoin’s price has fallen below two significant thresholds. On the 17th of December, the daily timeframe chart revealed a drop below the $42,000 mark.
The chart also indicated a slight dip below the $41,000 range at the time of this writing. This downward trend has characterized the price movement since it surpassed $40,000.
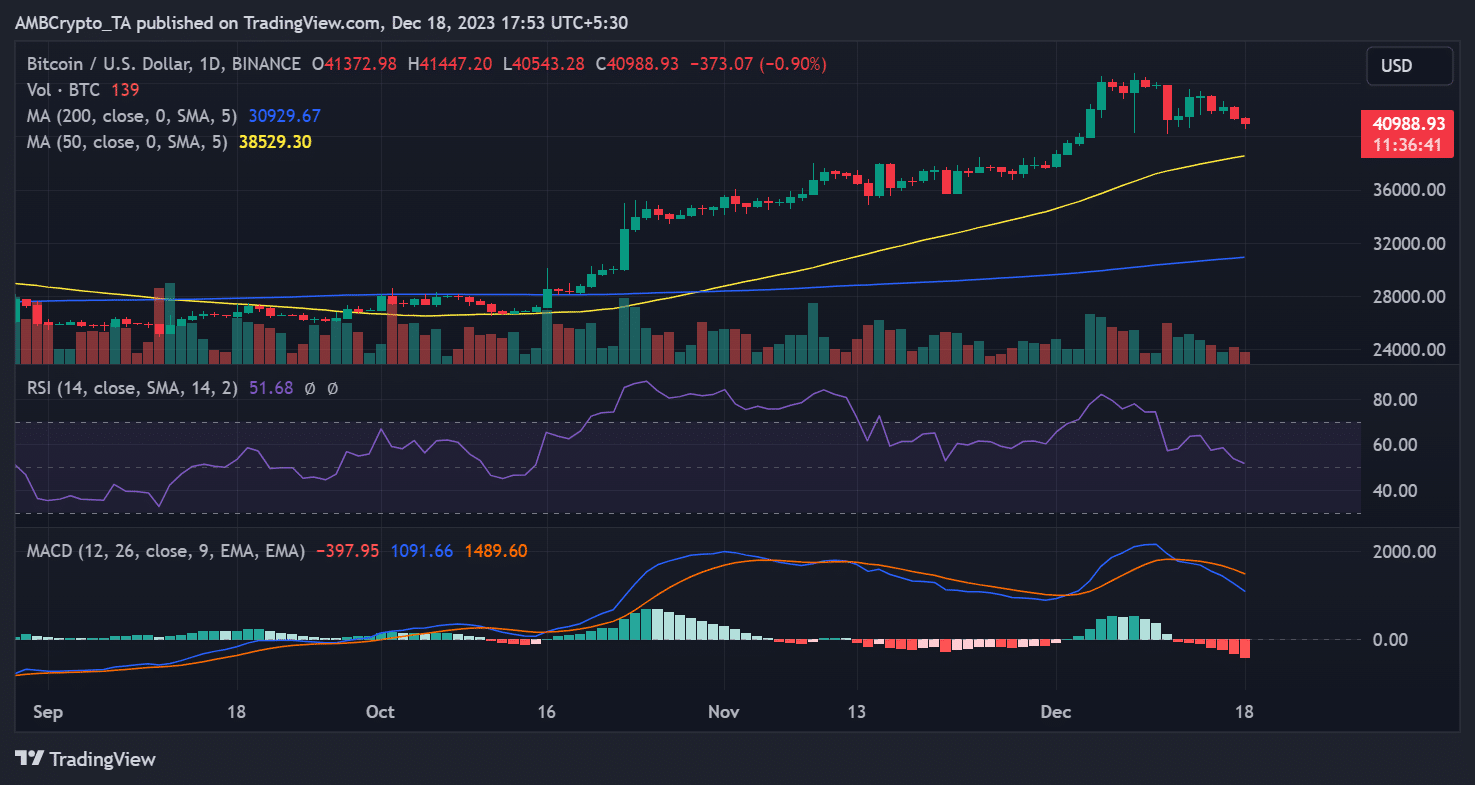
Also, as of this writing, the Moving Average Convergence Divergence (MACD) trend has turned negative, signaling a bearish trend.
This observation aligned with the confirmation provided by the Relative Strength Index (RSI) line, which was around 50. The position of the RSI indicated a weak bullish trend and a potential shift to a bearish trend shortly.
Bitcoin long traders continue to take hits
Although the sentiment remained positive despite the recent price drop, it was declining. AMBCrypto found that, as per Coinglass’ data, there was a decrease in Bitcoin’s Funding Rate following the drop in its price.
As of this writing, the Funding Rate was around 0.010%, down from 0.014 on the 17th of December. This Funding Rate suggested that fewer traders showed optimism about a price increase.
Additionally, due to the price decline, more long positions have been liquidated than short ones.
According to Coinglass, on the 17th of December, long positions experienced a liquidation of over $30 million, while short positions saw a liquidation of $5 million.
This trend persisted at press time, with the latest data showing continued liquidation of long positions at over $29 million and around $3 million for short positions.
Read Bitcoin’s [BTC] Price Prediction 2023-24
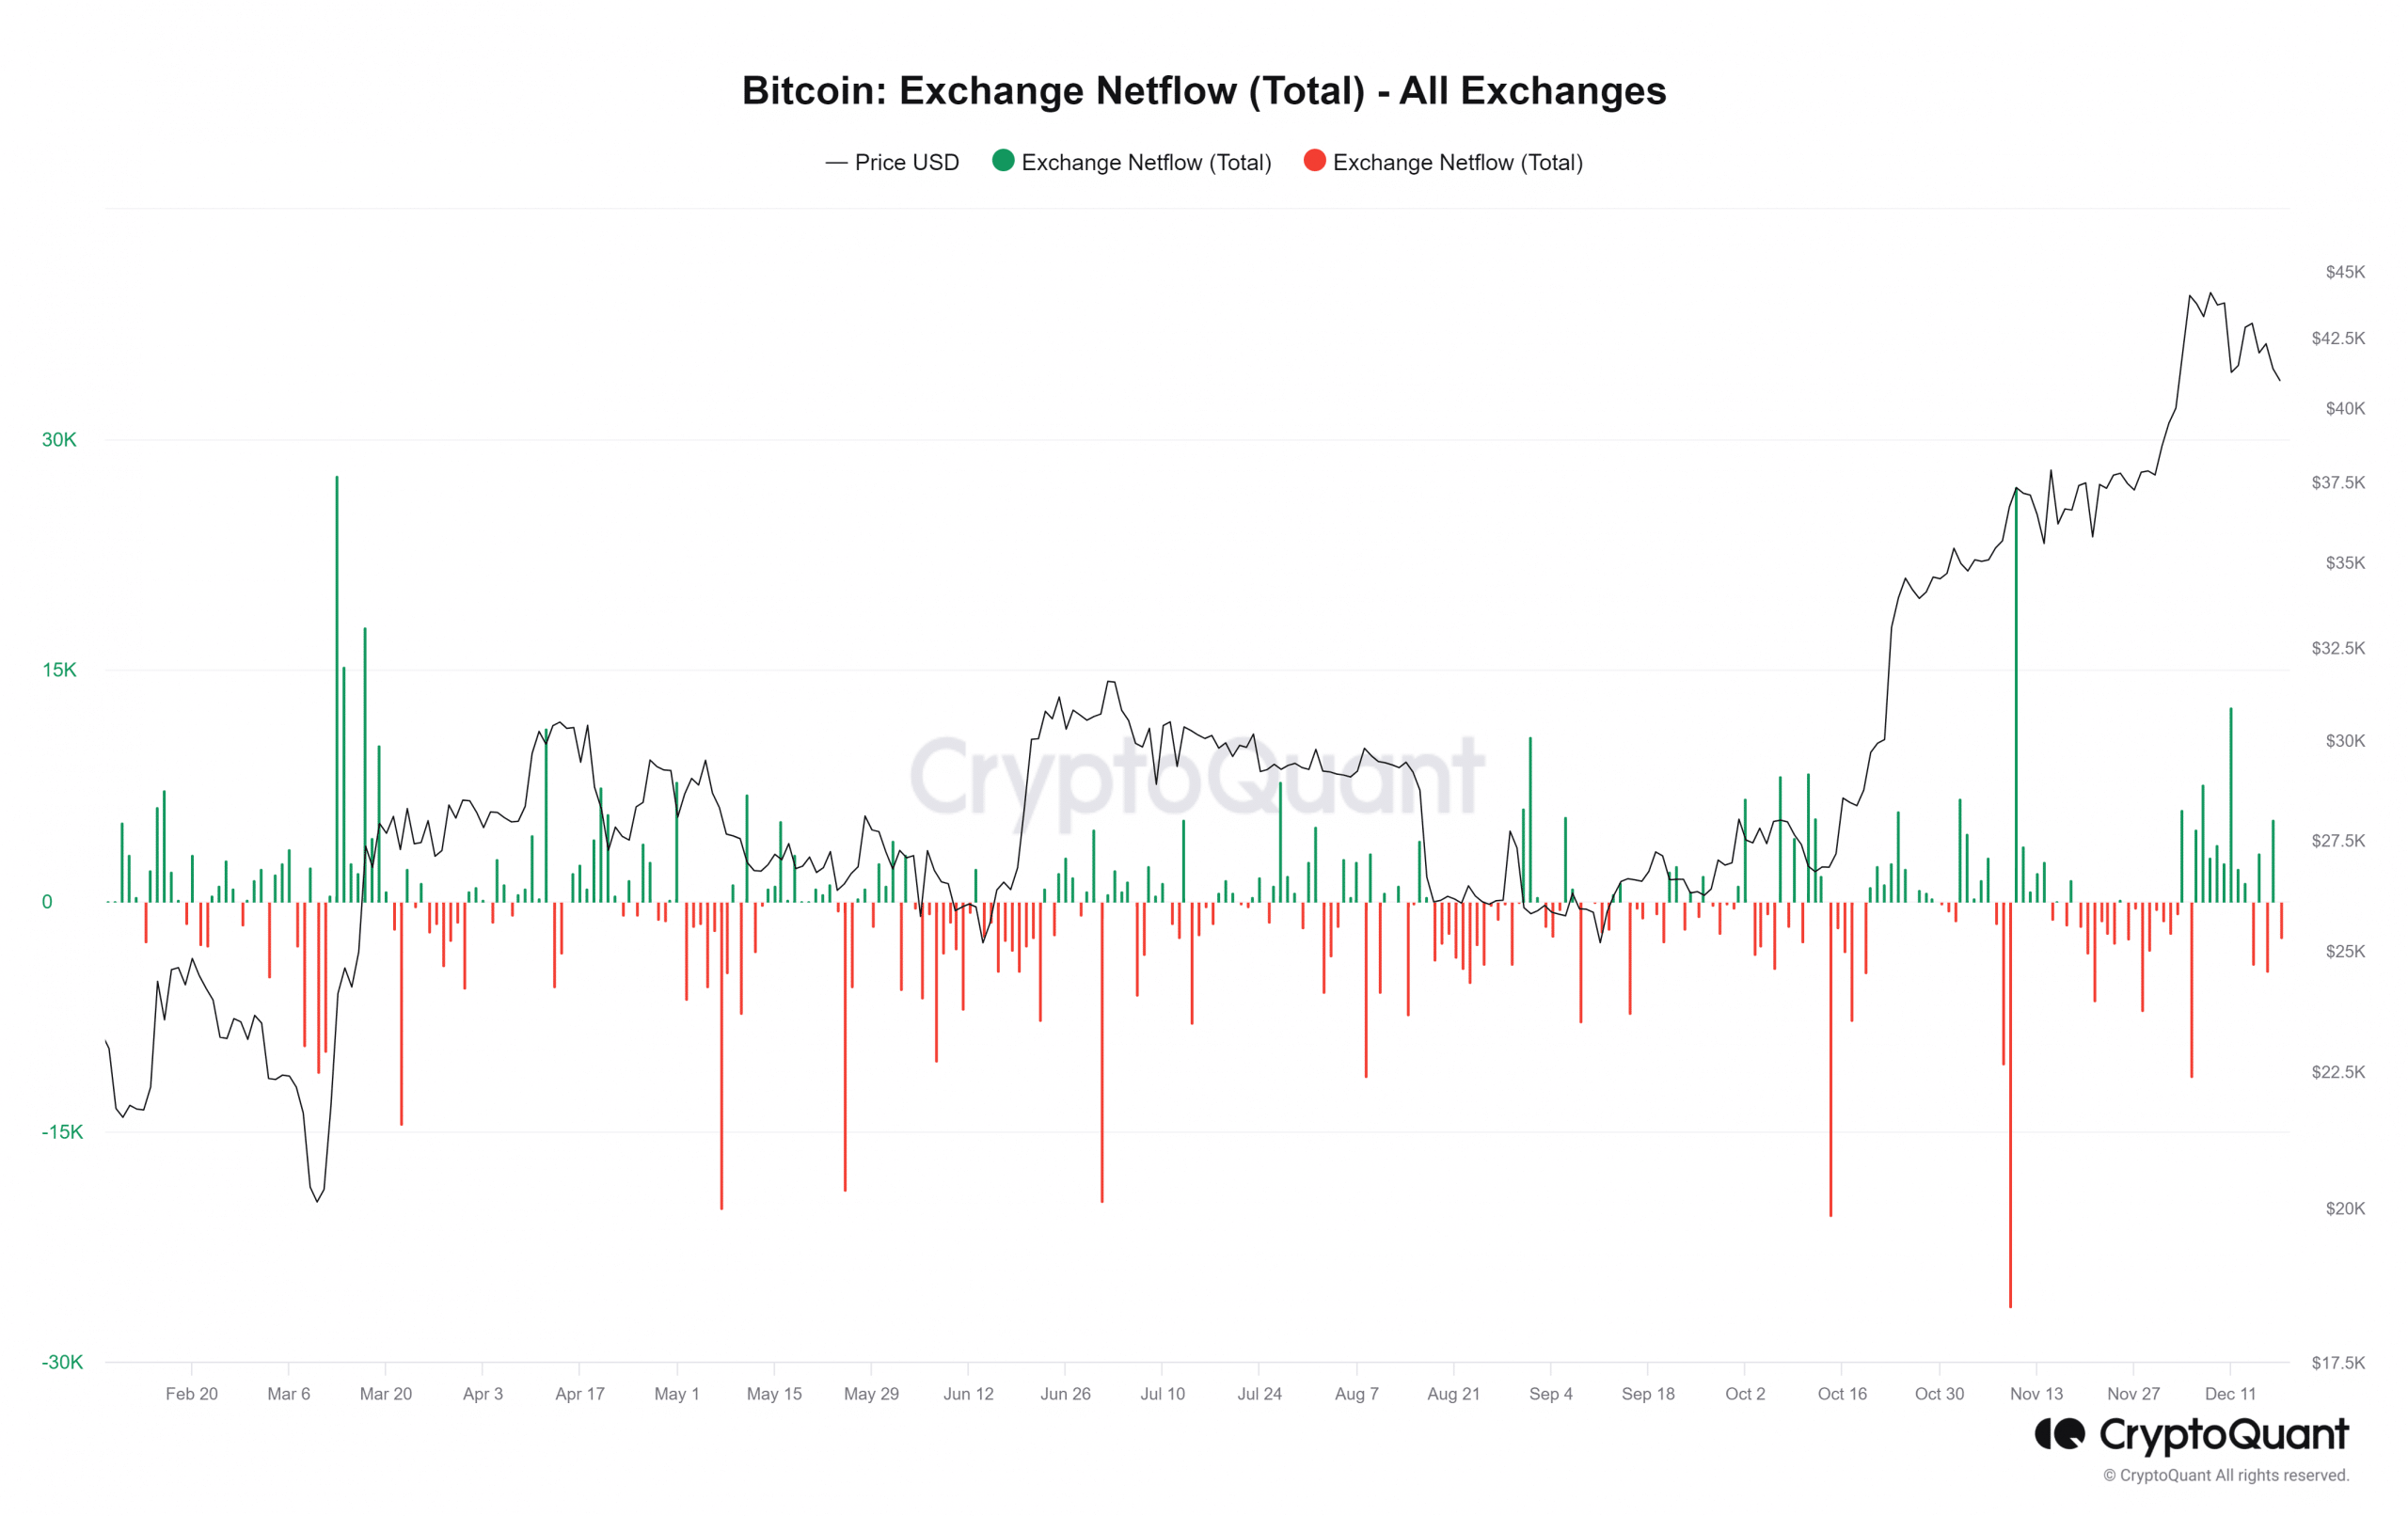
Bitcoin inflows dominate exchange flows
The Bitcoin exchange flow chart reveals increased BTC movements into exchanges recently. The move signaled a potential sell-off that may account for observed price fluctuations.
As of this writing, there were indications of a temporary halt in this inflow, with a notable increase in outflow. Additionally, over 2,000 BTC have been withdrawn from exchanges.