Why Ethereum’s [ETH] next stop downward is $2,900

Ethereum price showed a bullish future since mid-March. As it moved into the first week of April, ETH started to slow down its momentum, leading to a reversal. Due to the reversal, the smart contract token has set up a classic bearish setup that indicates a further downside.
Ethereum price reverses its trend
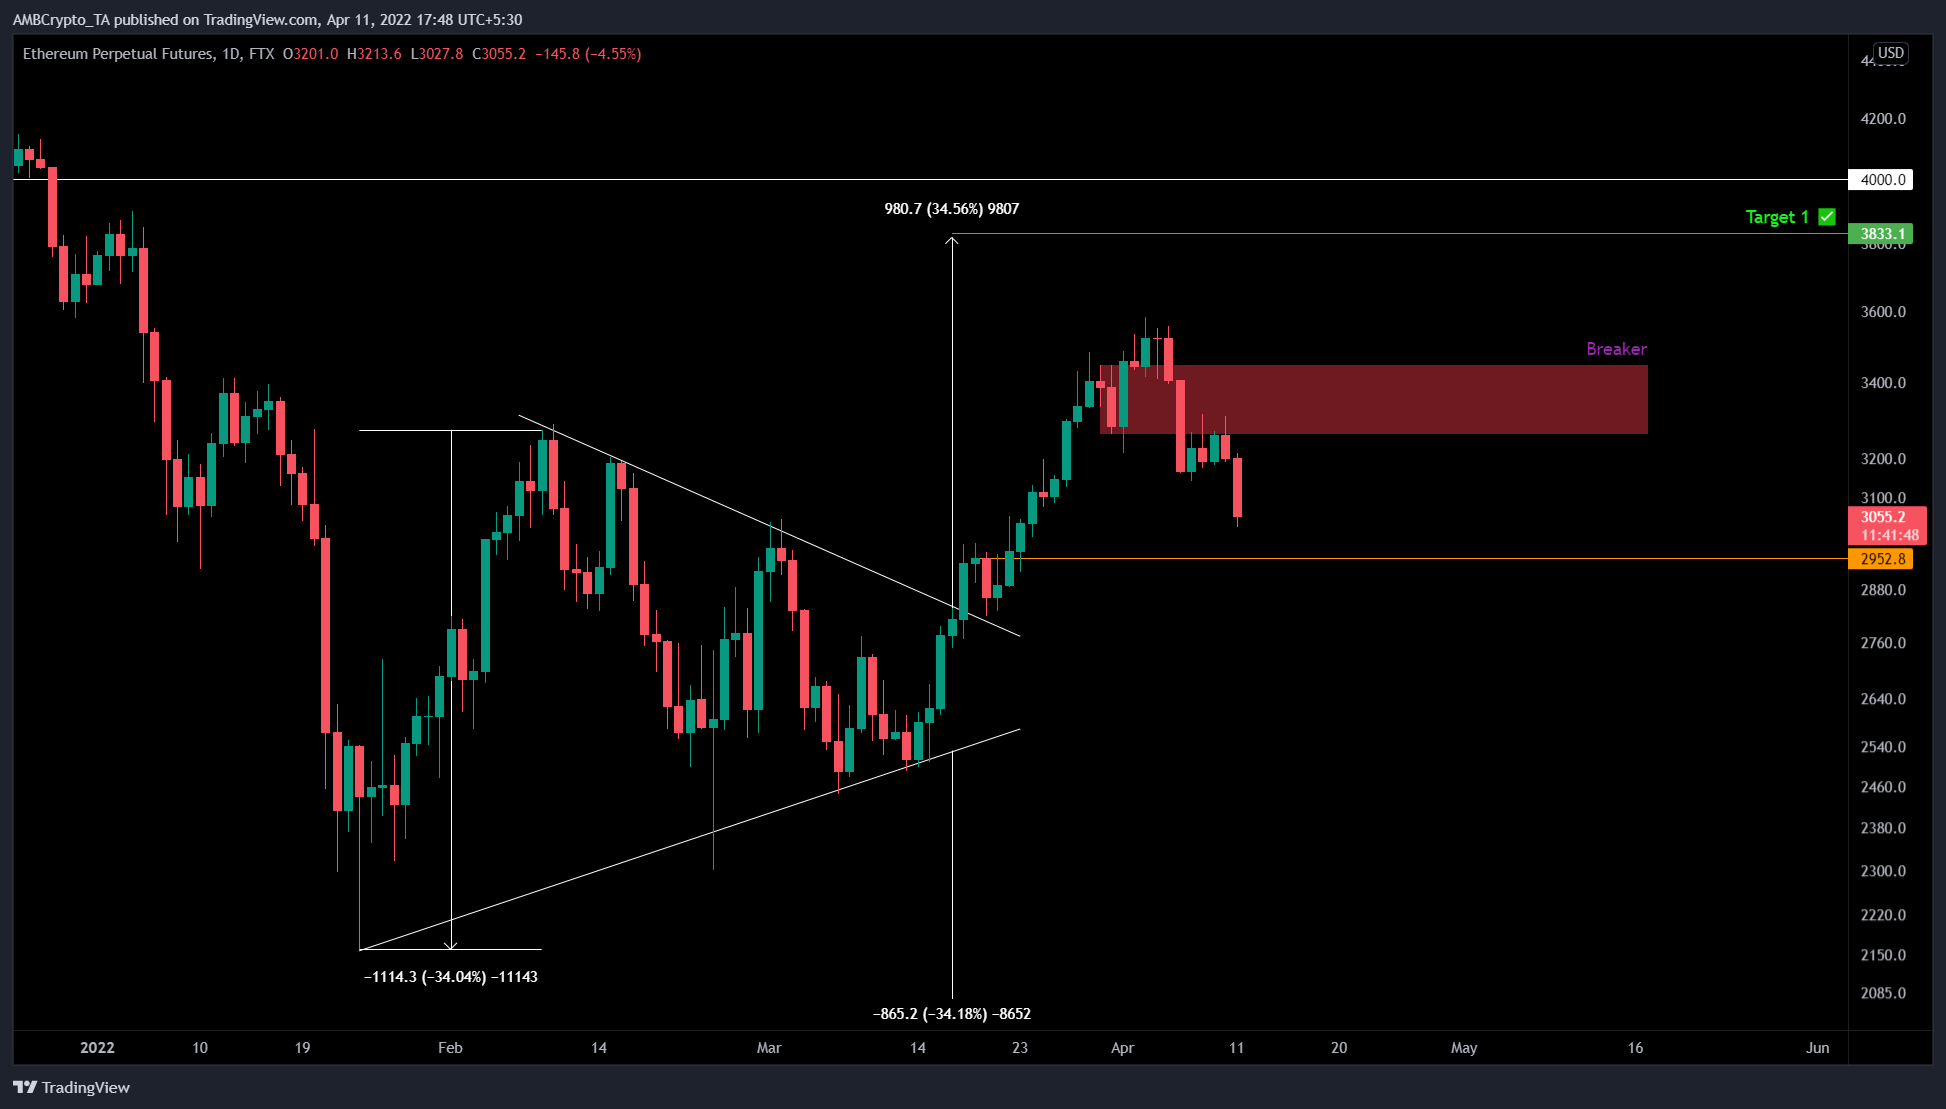
Ethereum price action between 24 January and 27 March set up a symmetrical triangle pattern with three lower highs and four higher lows which are connected using trend lines. The 34% target for this pattern is obtained by measuring the distance between the initial swing points of the triangle and adding it to the breakout point at $2,837.
Although ETH breached the upper trend line of the symmetrical triangle on 18 March, it failed to reach its target of $3,818. Instead, the Ethereum price created a bearish breaker. This technical formation contains a market structure break followed by a flip of the demand zone formed in between the two peaks.
Likewise, ETH set two higher highs at $3,484 and $3,583 on 29 March and 3 April, respectively with a demand zone formed in between these two peaks that extended from $3,263 to $3,448. However, on 6 April, ETH breached this demand zone, flipping it into a bearish breaker.
Now, interested investors can wait for Ethereum price to move higher and retest the said breaker to short ETH. A spike in selling pressure will likely knock Ethereum price to $2,952. This short position would yield a 10% gain, but ETH has already begun its journey to the south.
In a dire case scenario, a breakdown of the $2,952 support level, ETH could crash to $2,572, where buyers can jump in and start accumulating ETH for a discount and alleviate the selling pressure.
Adding a tailwind to the bearish outlook for Ethereum price is the 30-day Market Value to Realized Value (MVRV) model. This indicator is used to assess the average profit/loss of investors that purchased ETH tokens over the past month.
A negative value below -10% indicates that short-term holders are at a loss and is typically where long-term holders tend to accumulate. Therefore, a value below -10% is often referred to as an “opportunity zone.”

After the recent run-up to $3,500, the MVRV was hovering around a local top at roughly 10%. Therefore, the current downswing complements the ongoing downswing. Interestingly, the local bottom for ETH based on the MVRV is around -9.3%, suggesting that a further downswing is likely.