Why LINK could give investors a run for their money in the coming days
Chainlink continued to bounce between the $7-$7.6 levels over the past two weeks, and neither the bulls nor the bears had the strength to drive prices past either level.

Disclaimer: The information presented does not constitute financial, investment, trading, or other types of advice and is solely the writer’s opinion
Chainlink continued to trade within a long-term range that extended back to June 2022. A recent report highlighted that LINK might be undervalued, and bulls could look to accumulate the token.
Read Chainlink’s [LINK] Price Prediction 2023-24
Yet the indicators did not show significant demand behind the asset. Instead, Chainlink sellers continued to have the upper hand. Can the bullishness behind Bitcoin seep into the Chainlink market?
The $7-$7.6 has been a battleground in the past two weeks

The long-term range was highlighted by the yellow channel. Its mid-point sat at the $7.6 mark. This was a level of resistance that LINK bulls have been unable to crack since early March.
Another interesting factor was that Chainlink was coiling up within the $7-$7.6 region on the lower timeframes. This phase of contraction could be followed by a sharp expansion upward. However, this optimistic scenario was not backed by the indicators.
Realistic or not, here’s LINK’s market cap in BTC’s terms
The OBV has slowly declined over the past month, which showed steady selling pressure. The RSI hovered just above the neutral 50 mark and showed a lack of momentum, and equilibrium between bulls and bears.
Although the market structure on the daily timeframe was bullish, it weakened recently, and the $6.8-$7 zone of support could be tested once more.
Can the falling network growth and development activity alarm investors?
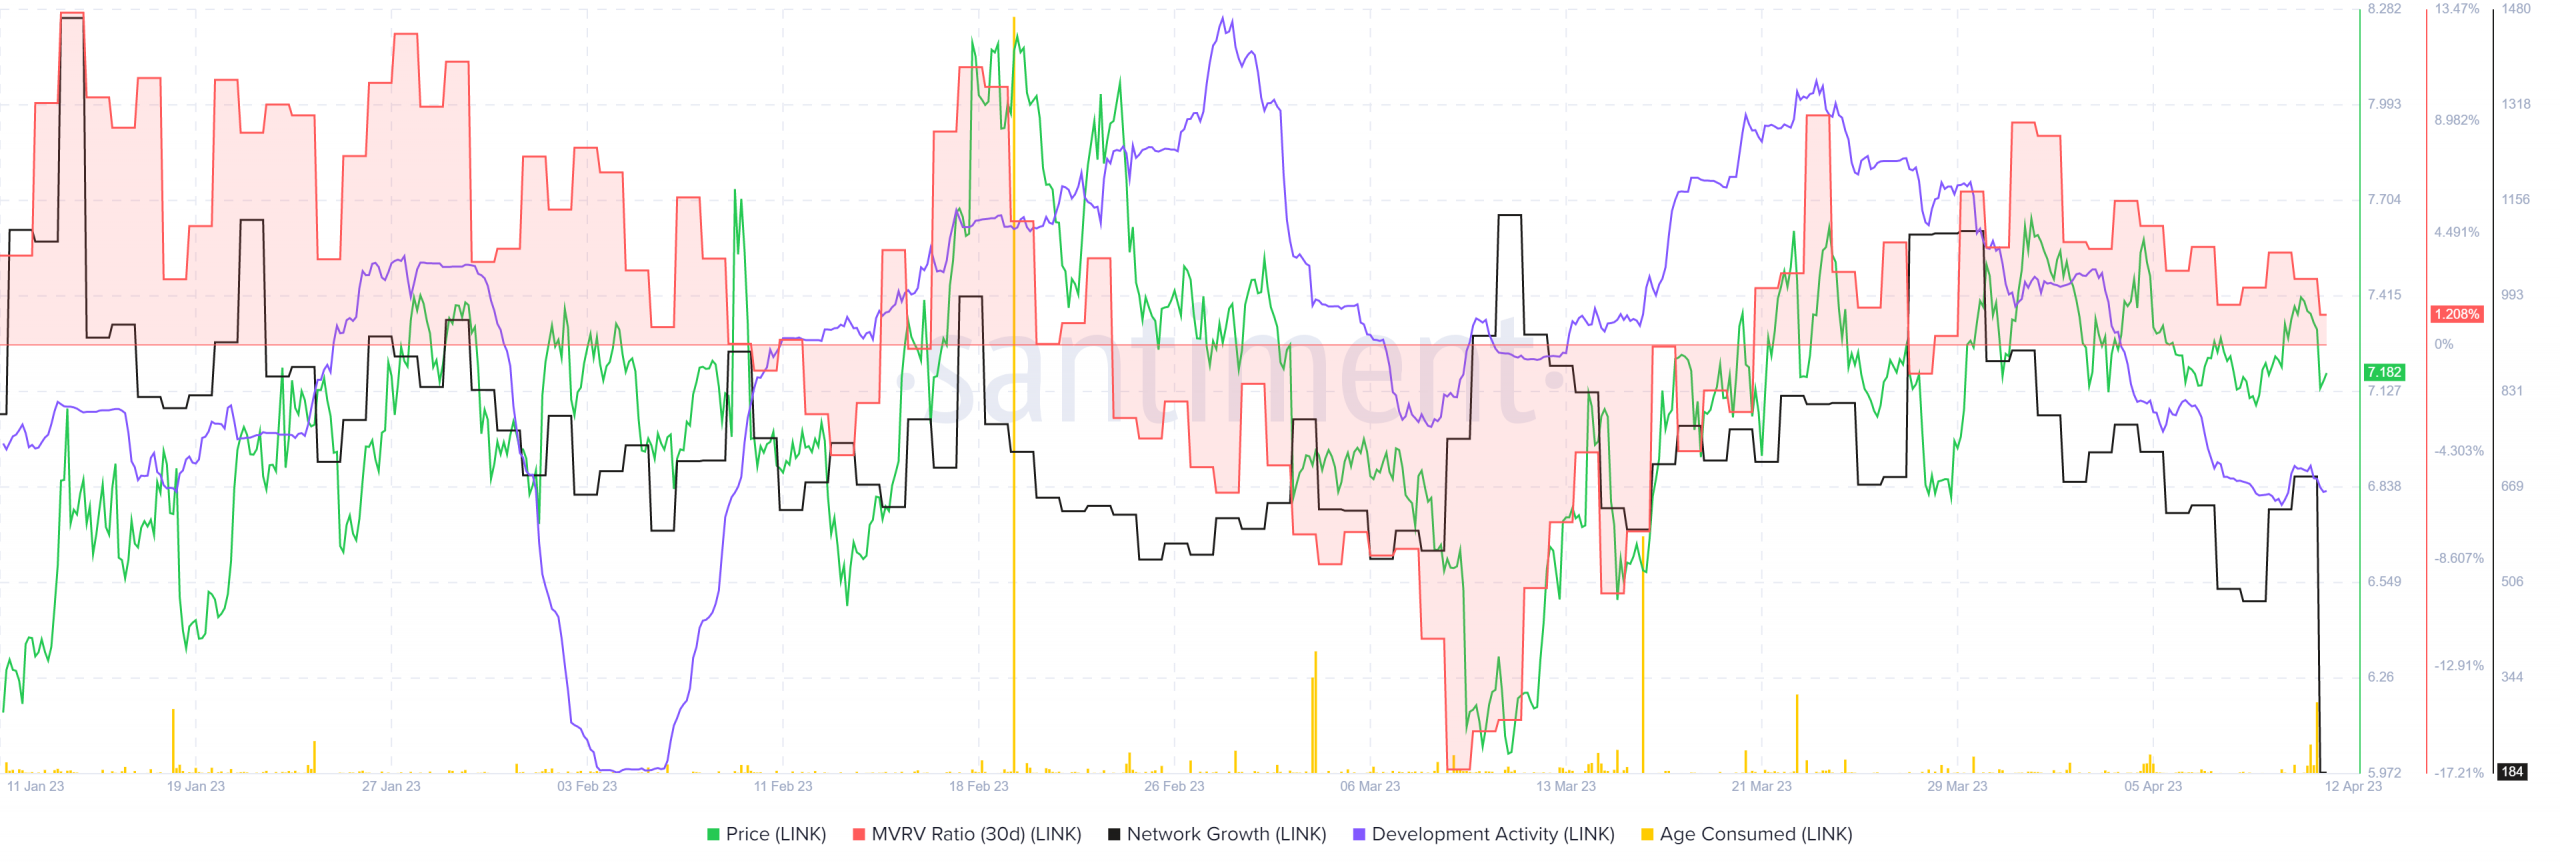
The short answer is yes. Network growth, which shows the number of new addresses created on the account each day, has been flat over the past three months, with considerable ebb and flow. But on 10 April the metric reached the lowest it had in three months.
Meanwhile, the development activity has also been in a downtrend. This was not something to be alarmed about by itself, but its combination with falling growth could spook some long-term investors.
The MVRV ratio was also spiraling downward, which showed holders were taking profits. Yet the lack of significant activity on the age consumed metric suggested that a burst of intense selling was not witnessed over the past month.