Why MATIC investors must be wary of these possible outcomes

Disclaimer: The findings of the following analysis are the sole opinions of the writer and should not be considered investment advice.
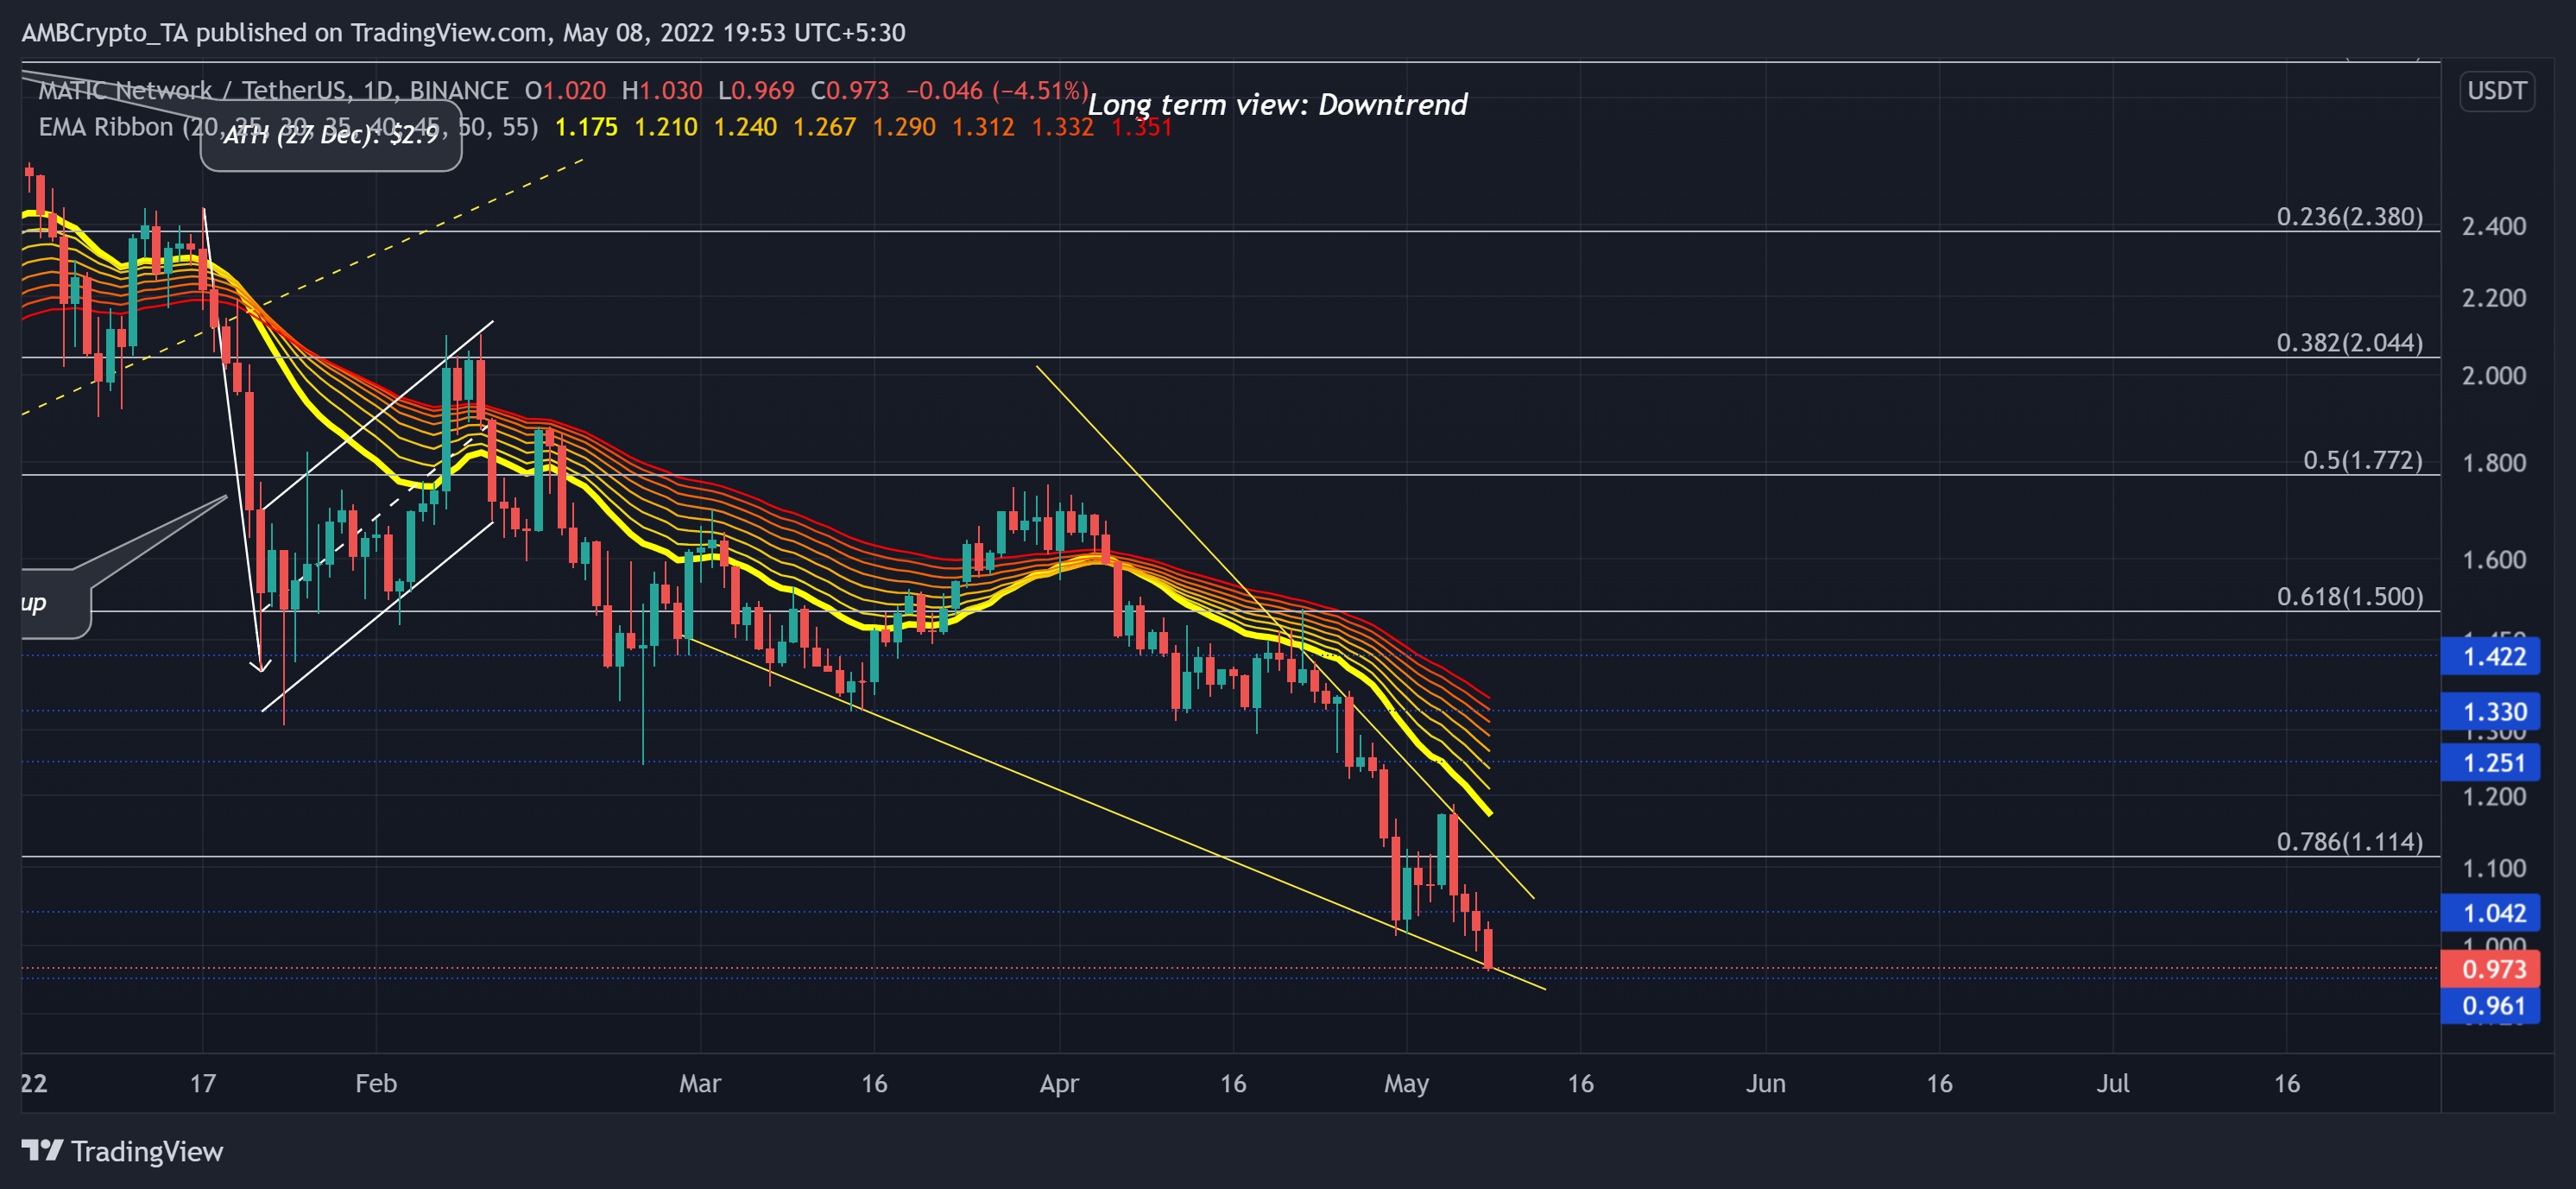
Polygon (MATIC) was on a long-term uptrend as it formed a six-month-long rising wedge (yellow) and hit its ATH on 27 December. Since then, however, the alt has been on a downhill while having a topsy-turvy relationship with the EMA ribbons.
As the current falling wedge decline approaches the long-term floor at $0.961, the bulls would be keen to break the streak of bearish candlesticks on the daily chart. At press time, MATIC was trading at $0.973, down by 6.5% in the last 24 hours.
MATIC Daily Chart
The recent bearish flag reaffirmed the selling spree as MATIC fell below all its EMA ribbons to test the $0.96-support. Post an over 67% decline from its ATH, MATIC plunged towards its nine-month low at press time. During the descent, the 61.8% Fibonacci support posed hefty hurdles and compressed MATIC in a rectangle.
But the sellers visibly took over as the sellers pulled the alt below the golden Fibonacci level. With multiple bearish engulfing candlesticks, MATIC confirmed a bearish flag that gradually transposed into a falling wedge.
the $0.961-mark would be critical to determine the future movements of the alt. A convincing close above this mark could lead MATIC into a patterned breakout and test the sturdiness of its EMA ribbons. Considering the historical tendencies alongside the rising gap of these ribbons, the bears would most likely constrict this rally in the $1.2-$1.3 range.
Rationale
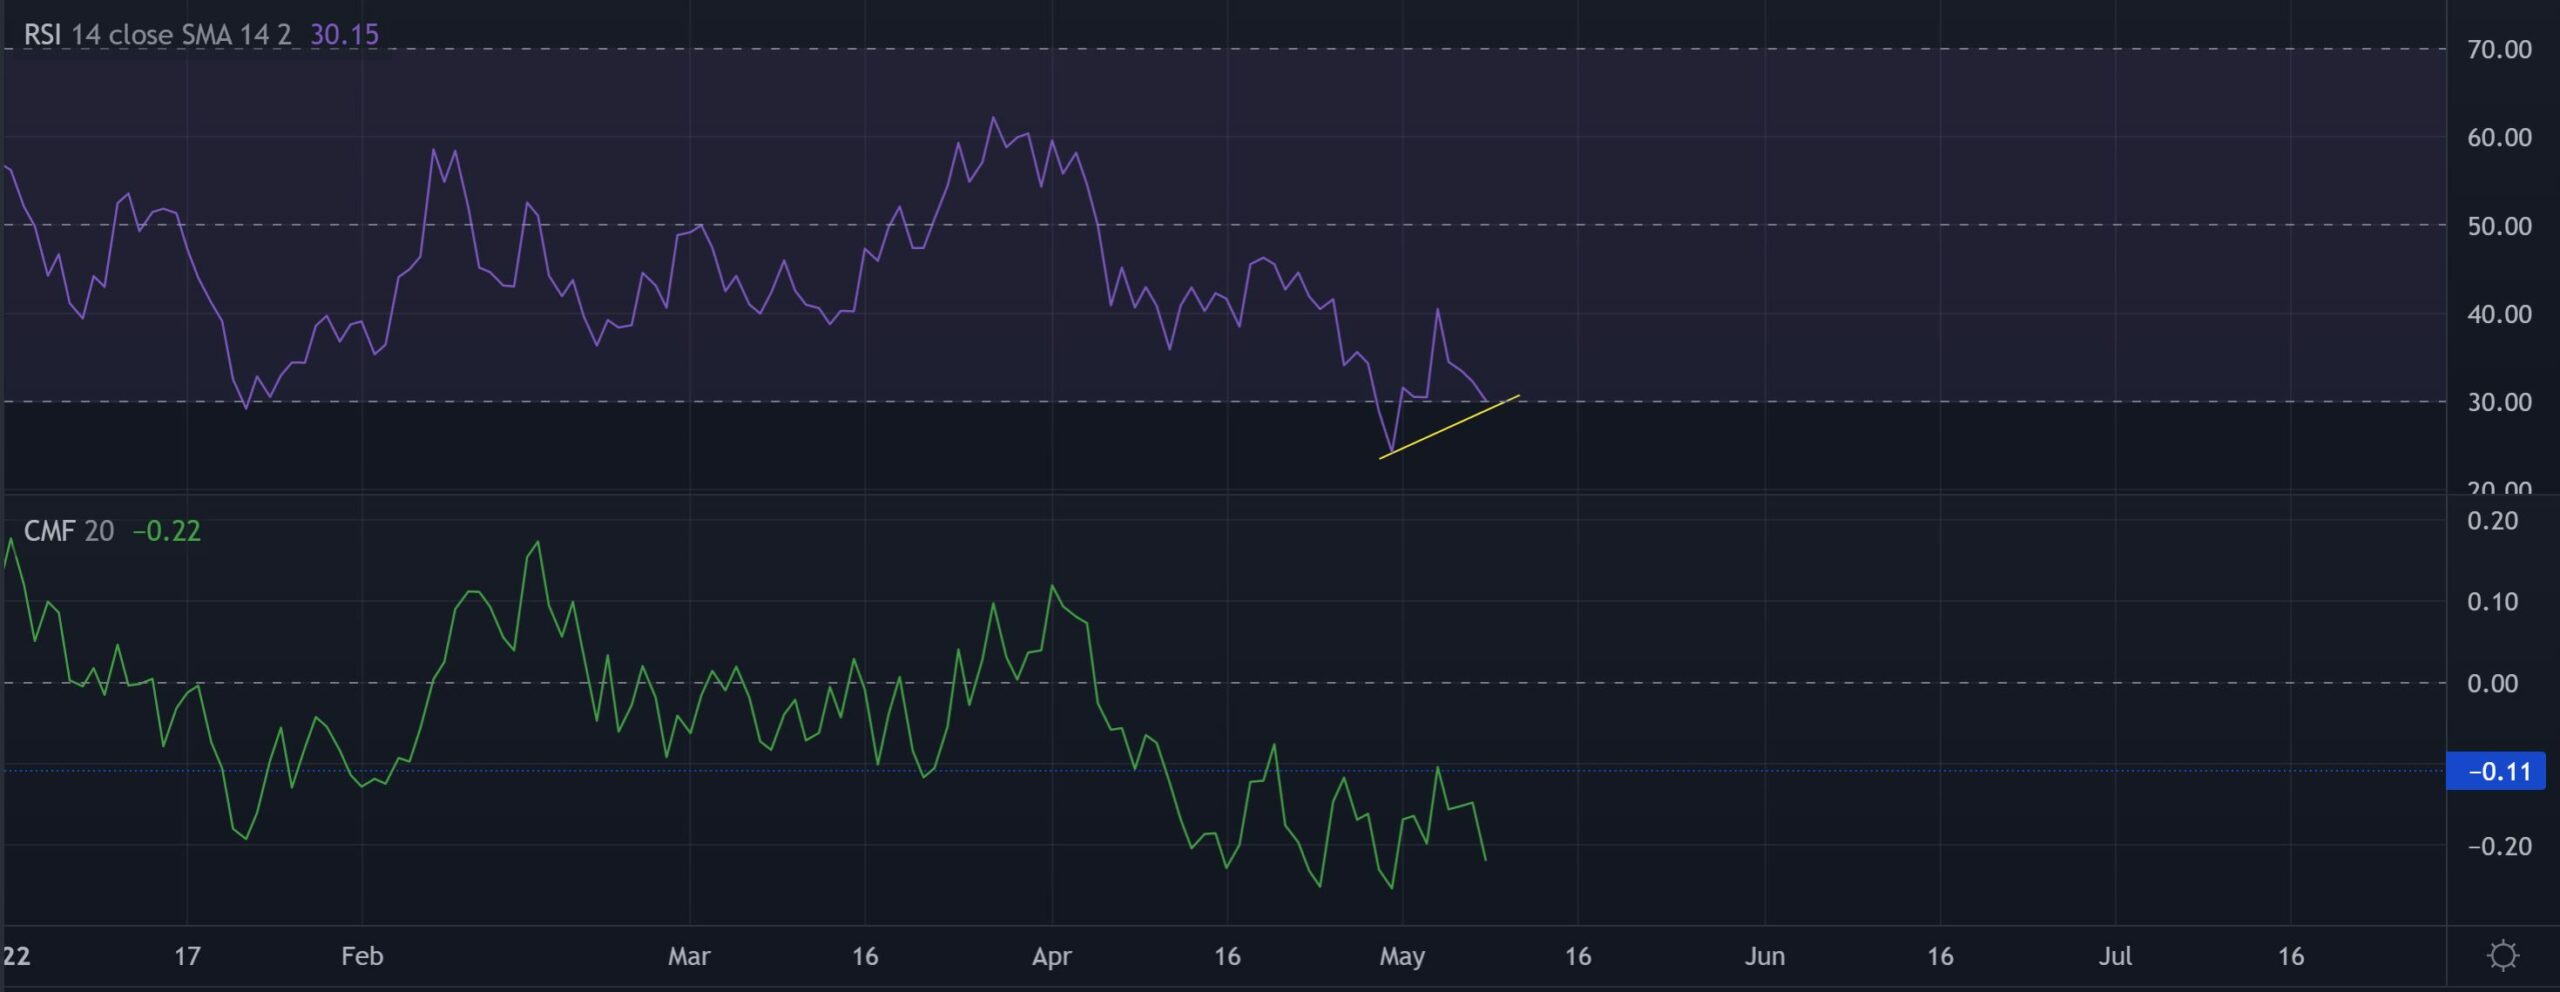
The RSI finally saw a revival from the oversold mark on its troughs over the last few days. A potential revival from its immediate trendline support (yellow) could confirm a bullish divergence with the price.
Also, the CMF withdrew itself from the -0.11-level and reaffirmed the decreasing money volumes into the crypto. This movement showed a bearish inclination. Nevertheless, its lows saw a similar trajectory to that of the RSI.
Conclusion
In light of the falling wedge set up coupled with the potential of bullish divergence on the RSI, MATIC could see a short-term revival. A close above the current pattern would expose the alt to test the boundaries of its EMA ribbons in the $1.2-$1.3 range.
Finally, the investors/traders must keep a close eye on Bitcoin’s movement as MATIC shares a staggering 90% 30-day correlation with the King coin.


