Why Polkadot traders must stay cautious

Polkadot’s trajectory has looked solid on the charts- its price has snapped new local highs ever week and provided monthly returns of 52% to its investors. Important resistance barriers at $17 and $19.5 have been toppled which pointed to further upside in the coming days. However, there were some short-term risks in the market. Several divergences were spotted across its indicators and a broadening wedge pattern threatened an incoming sell-off.
Polkadot 4-hour chart
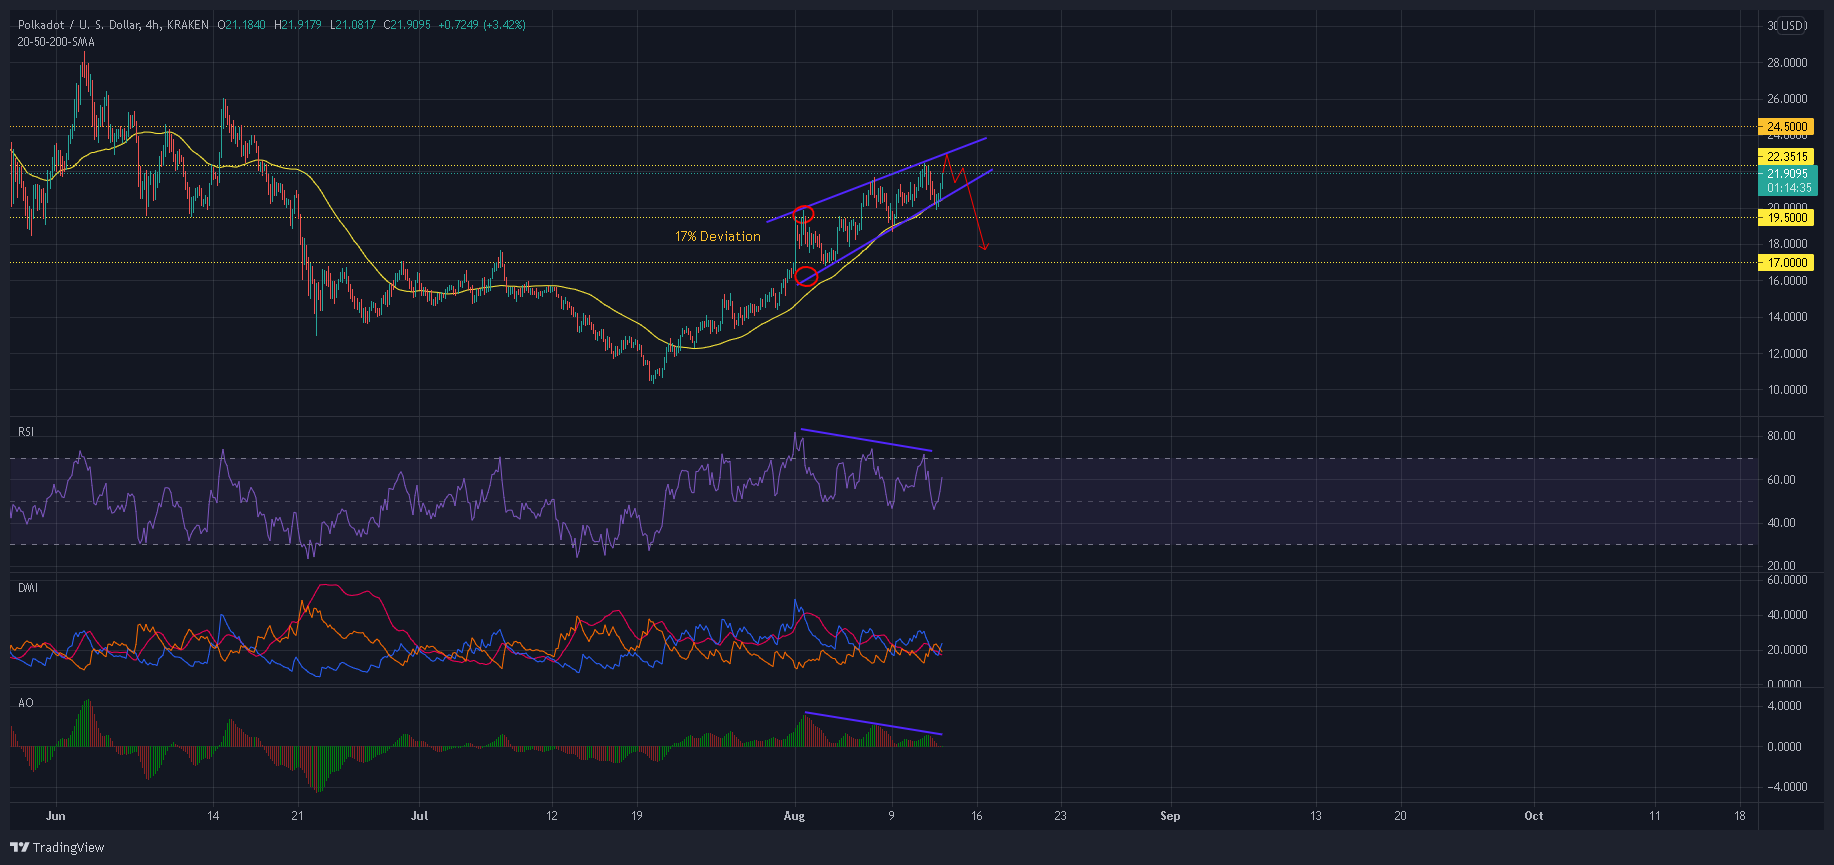
As a result of upwards pressure, Polkadot consistently closed above its daily 20-SMA (not shown) for two weeks. On the 4-hour timeframe, this correlated to higher highs and higher lows. At press time, DOT looked to form a new high possibly above the $23-mark but this did not overshadow some bearish signals in the market.
The 50-SMA (yellow) showed that DOT’s uptrend lost some some pace as prices began to converge towards the mid-term average line. In fact, bulls had to defend this moving average from a breakdown on two occasions- when DOT formed lower highs at $18.7 and $20.3, but it seemed like only a matter of time till the advantage was ceded over to bears.
There were also some concerns due to an ascending wedge pattern- a setup that usually triggers a market retracement. Based on the high and low points on the pattern, 17% pullback was on the table if DOT broke below the lower trendline.
Reasoning
While DOT moved in an upwards trajectory, RSI formed three lower peaks and indicated a bearish divergence. A new low formed below 45 would provide confirmation of an incoming decline. This divergence was also evident on the Squeeze Momentum Indicator which suggested that buyers were gradually losing strength. Finally, the DMI saw multiple crossovers over the past few weeks as a clear uptrend has failed to solidify.
Conclusion
The coming hours could see DOT form a higher peak at the $23-mark but this was in line with its broadening wedge pattern. Prices were then expected to move south and towards the lower trendline, from where a 17% pullback was possible. To negate this thesis, bulls needed to target a close above DOT’s 10th June swing high of $24.5.