


After the 38.2% Fibonacci resistance refuted the recent bull run, the sellers navigated the trend in their favor by sinking the price toward the $2.5 base. This has impacted the buyer’s ability to offer a vigorous counter in the Point of Control (POC, red) zone.
Should the selling pressure continue to endure, a close below the $2.6-mark could open up a route toward the retest of the $2.5-mark before a bull resurgence. At press time, SAND was trading at $2.69, up by 2.73% in the last 24 hours.
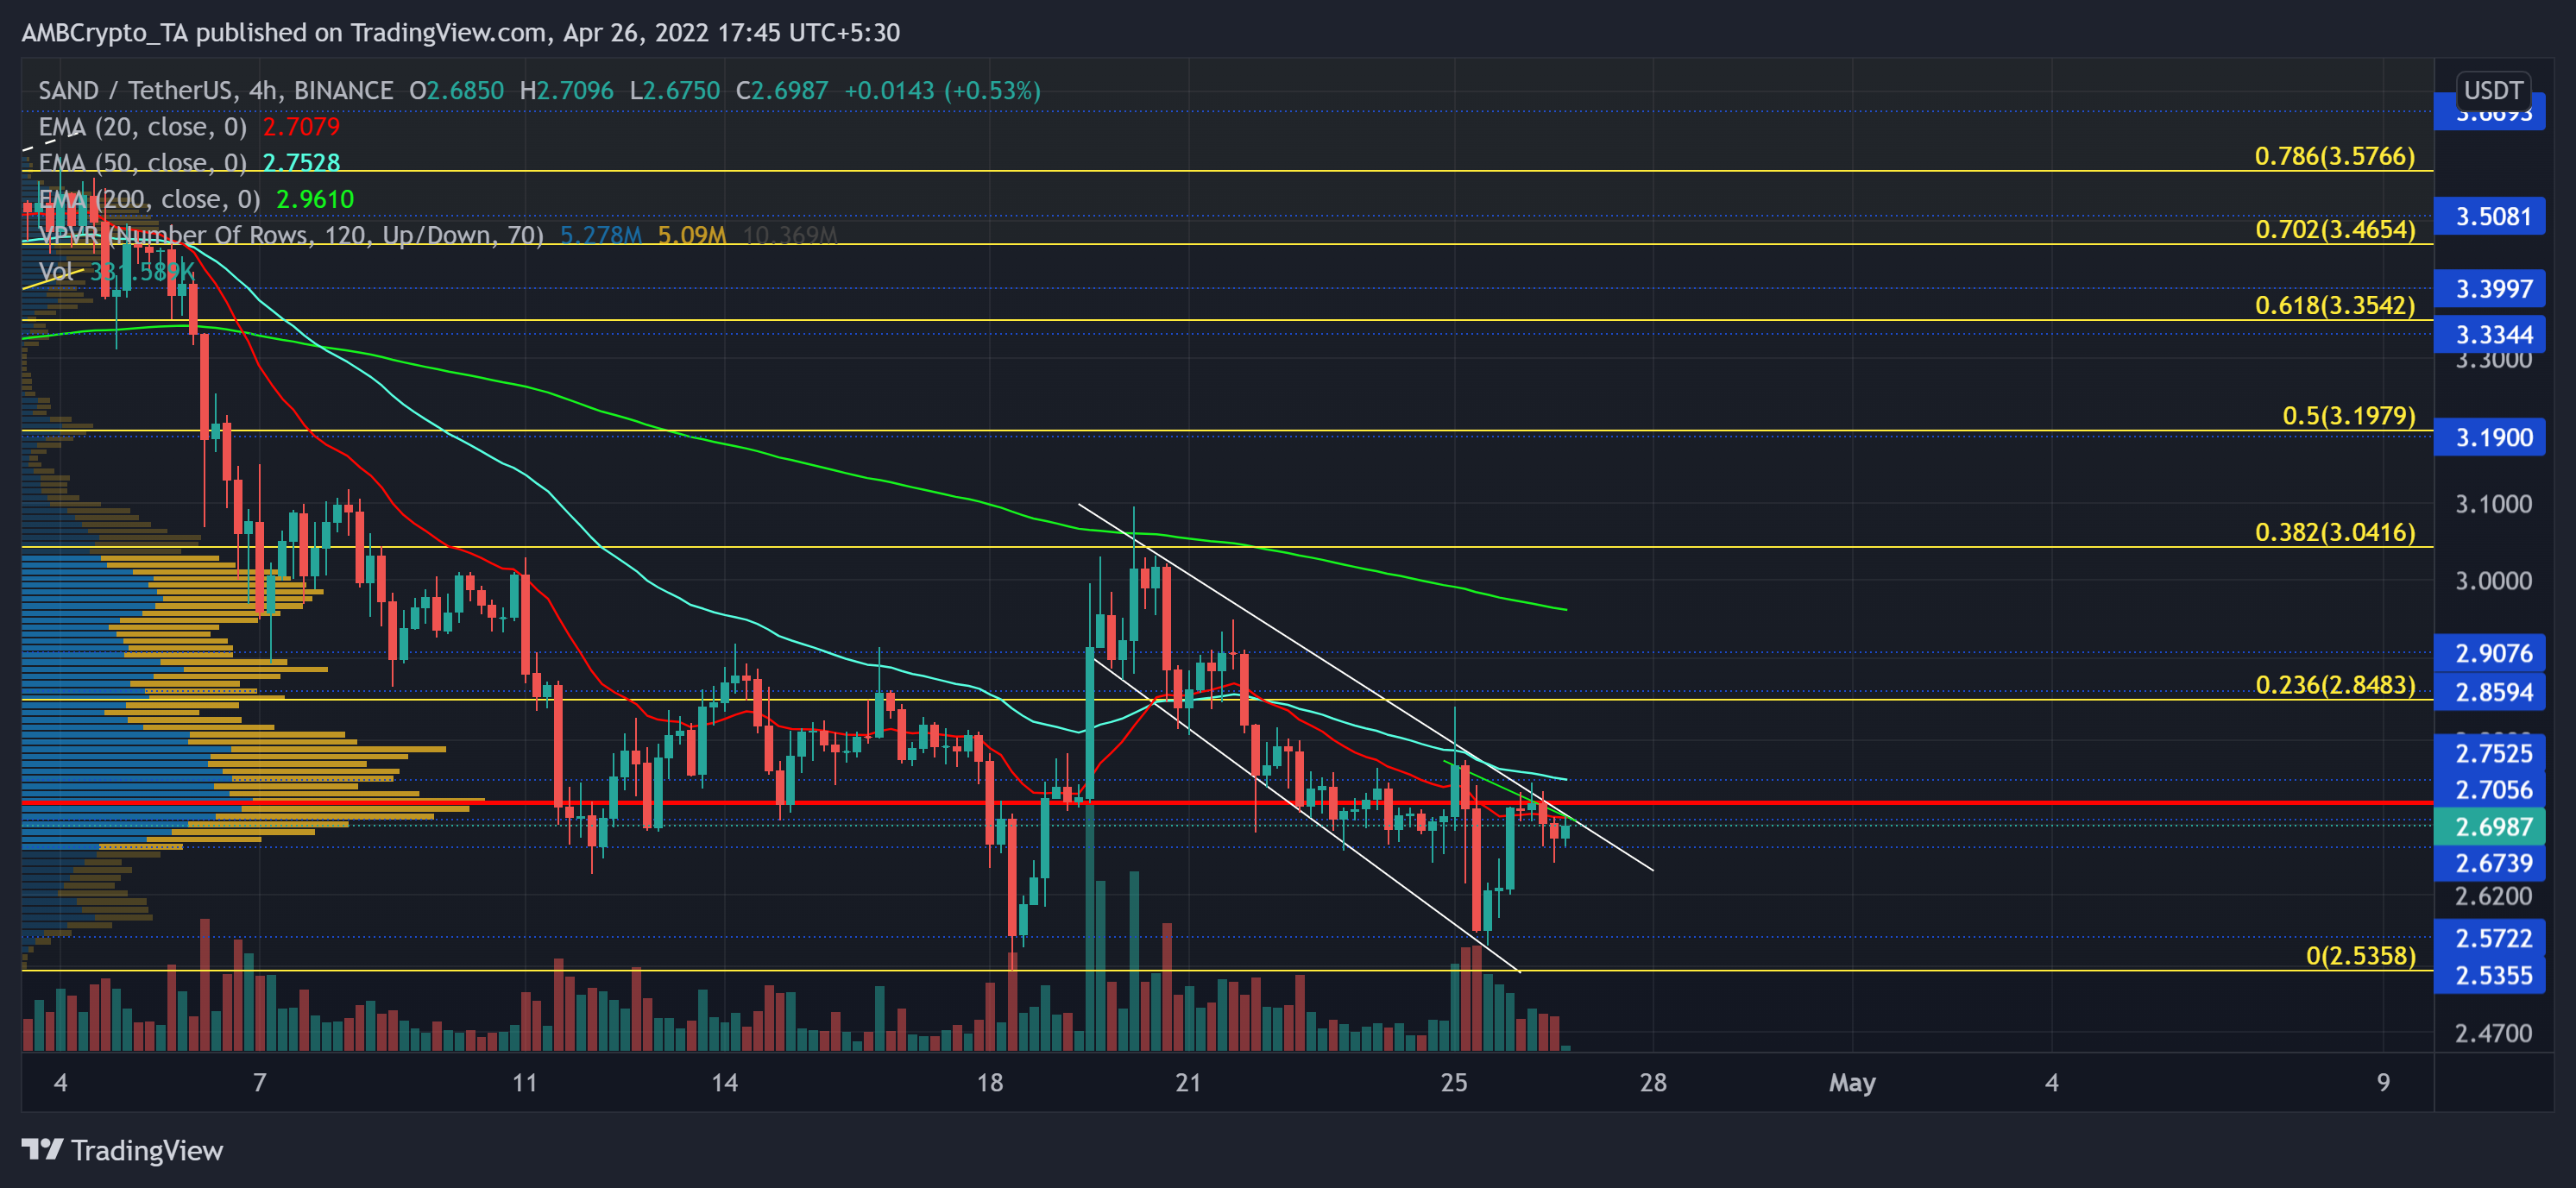
SAND 4-hour Chart
Since hitting its ATH last year, the bears have persistently marked lower peaks while the bulls upheld the $2.5 floor for over five months now. This trajectory visibly portrayed a superior bearish vigor while the bulls struggled to alter the long-term outlook to their fancy.
The recent buying rally from its long-term demand zone ceased at the 38.2% Fibonacci resistance, near its 200 EMA (green). Consequently, SAND was down by nearly 17.2% from 20-25 April. Resembling the market-wide recovery over the past day, SAND bounced back from its long-term support.
Giving due importance to the strength of the current trend, a likely fall from the $2.6-mark could push SAND for a retest of its long-term support. Unless the bulls show up on boosted volumes, the sellers would aim to persist on the current descending broadening wedge setup.
A possible break above the 20 EMA (red) in the coming times would elevate the chances of a possible breakout rally toward the POC and eventually the 23.6% level.
Rationale

the Relative Strength Index suggested that the sellers had an edge in the ongoing momentum. Failing to find an area above the 50-mark, the buyers still had to push for more to propel the price to break its current bounds.
Further, as the CMF witnessed a bearish divergence with price over the past day, it reversed from the 0.12-0.15 resistance range. To top all of this up, the ADX displayed a weak directional trend for SAND.
Conclusion
Should the immediate support stand strong, SAND would face barriers in the $2.7 zone in its recovery. With decreasing trading volumes, the bulls still needed to ramp up their game to trigger and sustain a rally beyond the POC. A fall below the $2.6-level would lead to a retest of its long-term support before a bullish comeback.
Besides, the alt shares a staggering 98% 30-day correlation with the king coin. Hence, keeping an eye on Bitcoin’s movement would be vital to complement these technical factors.