Why this could be a profitable bet for Polkadot investors

Since striking its all-time high on 4 November, Polkadot (DOT) sellers refused to give up their edge until the bulls halted the downslide at the $16.8-mark. The most recent recovery pushed the alt above its four-month-long trendline resistance (now support).
Going forward, DOT could see a near-term setback towards the $21-$22 range as the price hovered near its ten-week resistance. A close below its high liquidity range (Point of Control/POC) could heighten the prospects of a test of its long-term trendline support before the bulls try to push for an advantage. At press time, DOT traded at $22.85.
DOT 4-hour Chart
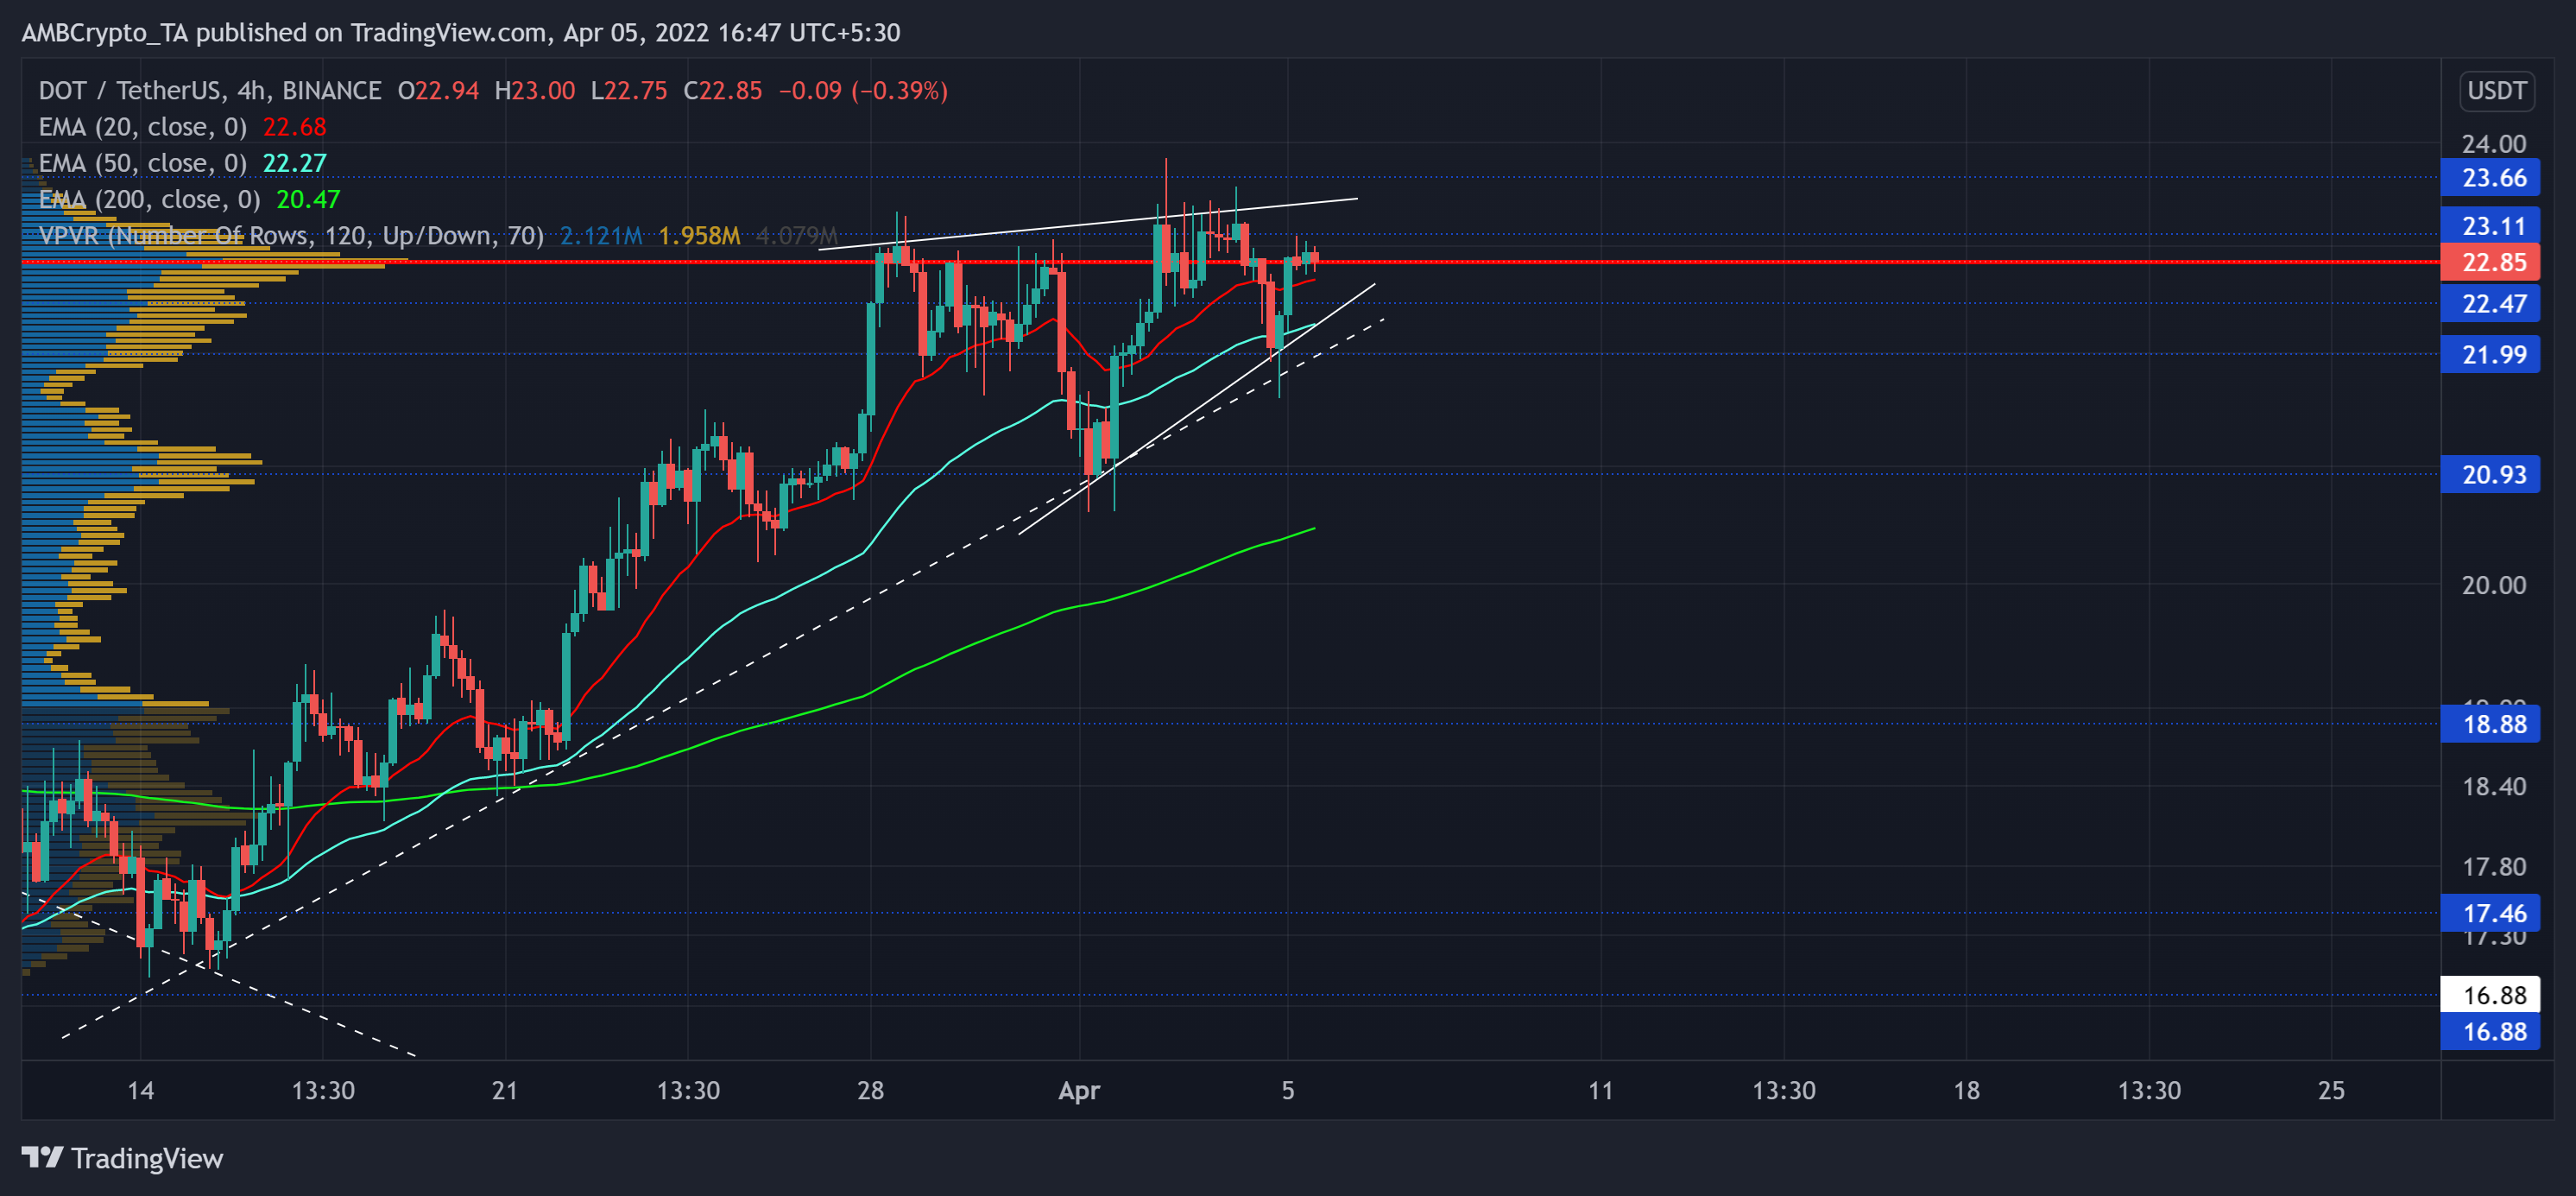
The bearish phase (from its ATH) led the alt to lose more than 74.5% of its value and plunge toward its seven-month low on 24 February.
The recent bullish rally marked bullish trendline support (white, dashed) while the alt crossed the 20/50/200EMA. The alt snapped its four-month trendline resistance and flipped it to support. This rally has seemingly found a hindrance near its POC where the clash between the buyers and sellers has spiked in the last few days.
The current price was still not overstretched from its 20-50 EMA. Thus, increasing the chances of high volatility in the days to come. From here on, any close below the POC could cause a test of the lower trendline of the rising wedge (white). Following this, the bulls could gather enough force to test the $23-zone before a trend commital move.
Rationale
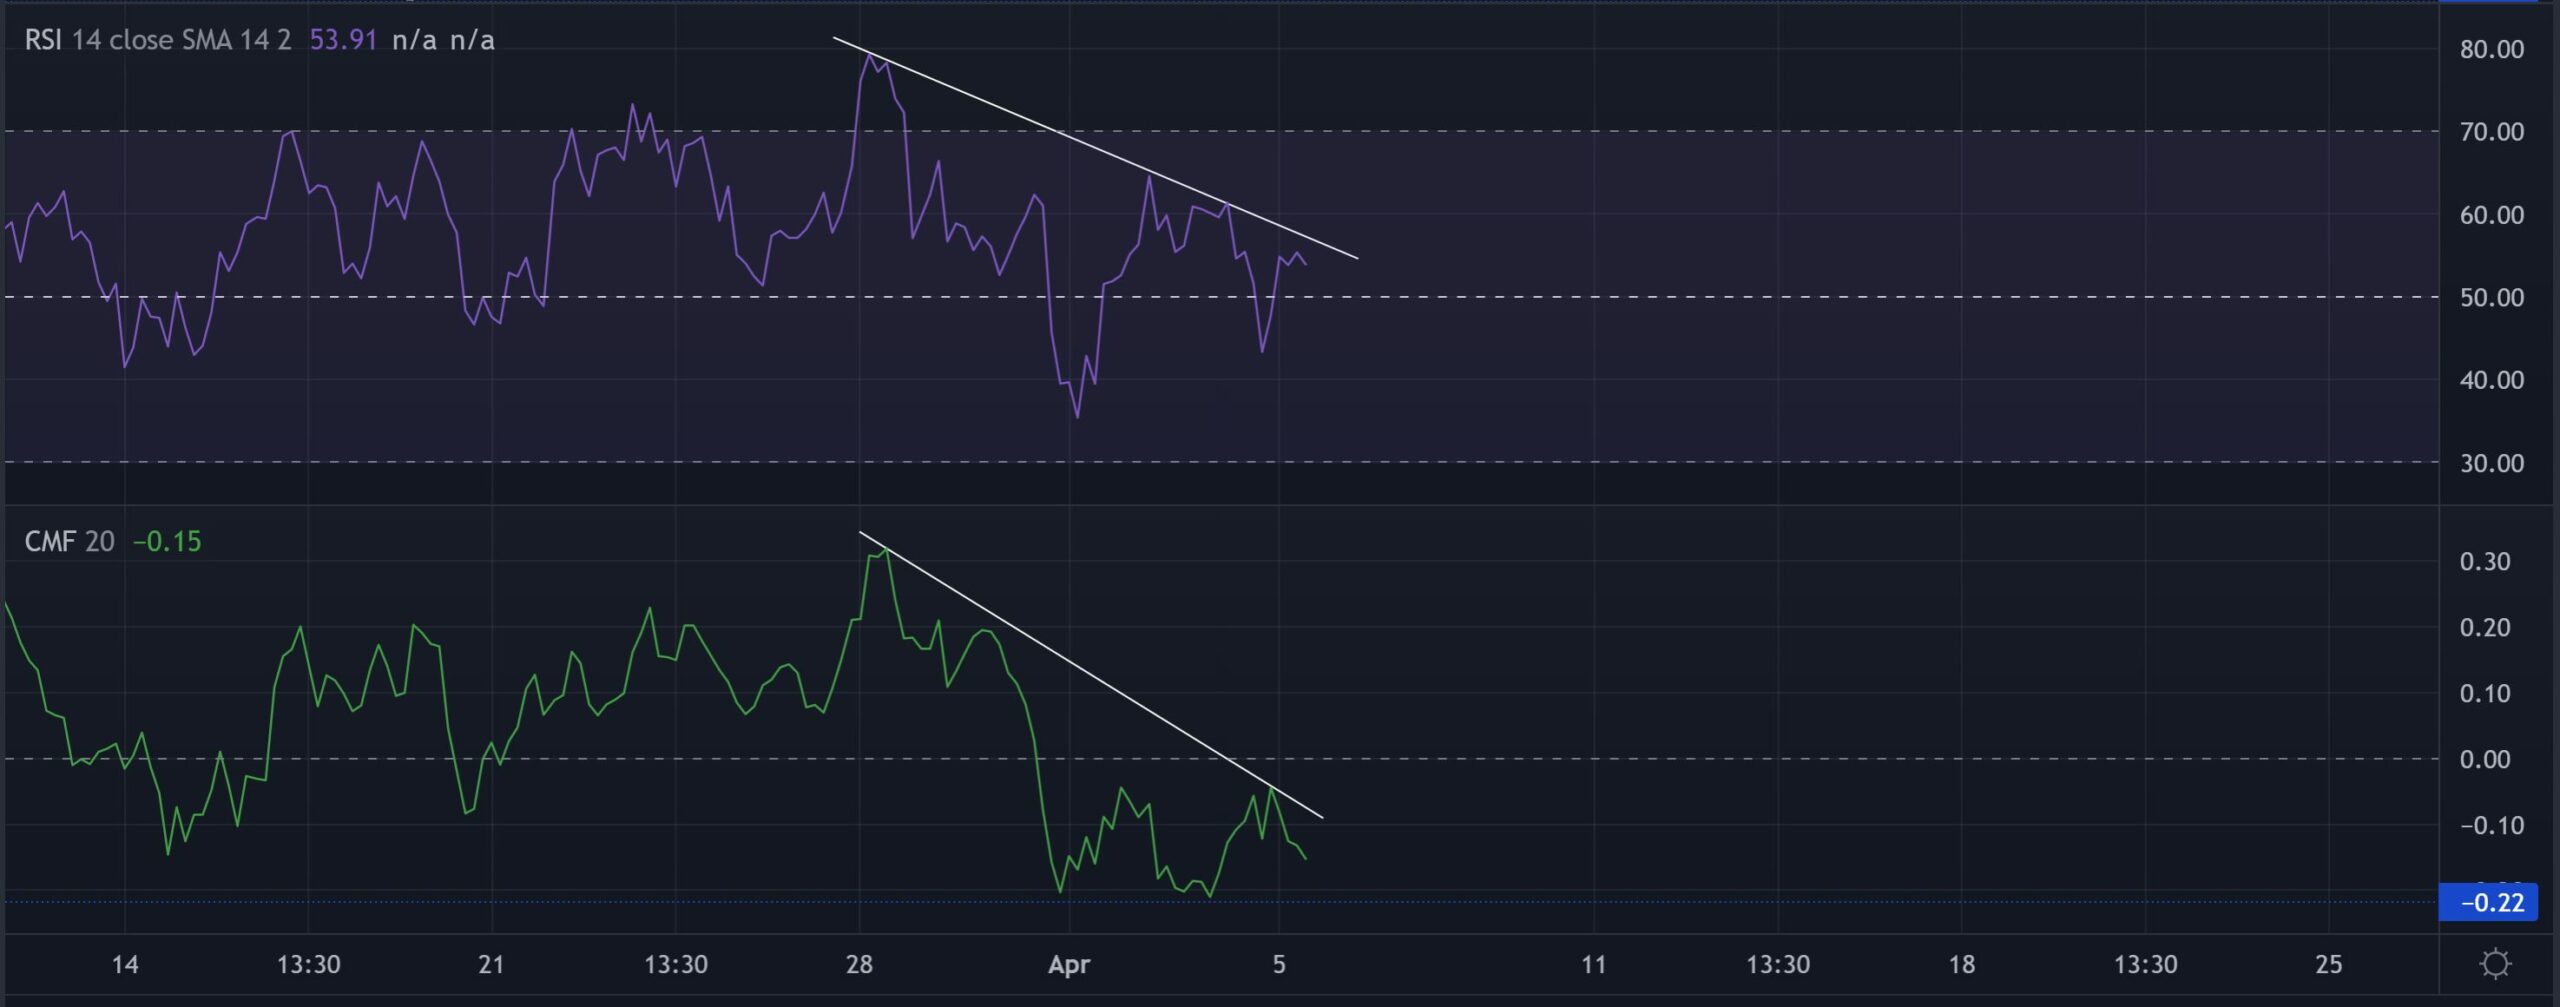
The RSI has steadily marked lower peaks in the last eight days as the bears kept exhibiting increased pressure. This trajectory was contrary to the price movement during this timeframe. Thus, revealing a bearish divergence on the 4-hour chart.
Furthermore, the CMF conformed to the RSI and paved a similar path while affirming a bearish divergence with price. Thus, the near-term recovery can halt at the trendline resistance.
Conclusion
Considering the potential of the divergences on the RSI and CMF, any recoveries can find hindrance at the $23-zone. A close below the POC would position DOT for a short-term setback towards the $21-$22 range before the bulls can reclaim their edge.
Furthermore, an overall market sentiment analysis becomes vital to complement the technical factors to make a profitable move.