
- Arbitrum’s descending channel may soon end, with analysts predicting a 2x rally if the breakout is confirmed.
- 94% of ARB holders are in the red, but a potential breakout could signal a major turnaround.
Arbitrum [ARB] has shown minor fluctuations in the past 24 hours, trading within a narrow range between $0.59 and $0.61. As of press time, ARB was trading at $0.5977, representing a 0.85% increase over the last day and an 11.23% rise over the past week.
With a circulating supply of 3.5 billion ARB tokens, the current market capitalization stands at $2.09 billion, supported by a trading volume of $182.4 million in the past 24 hours.
Market analyst Captain Faibik noted,
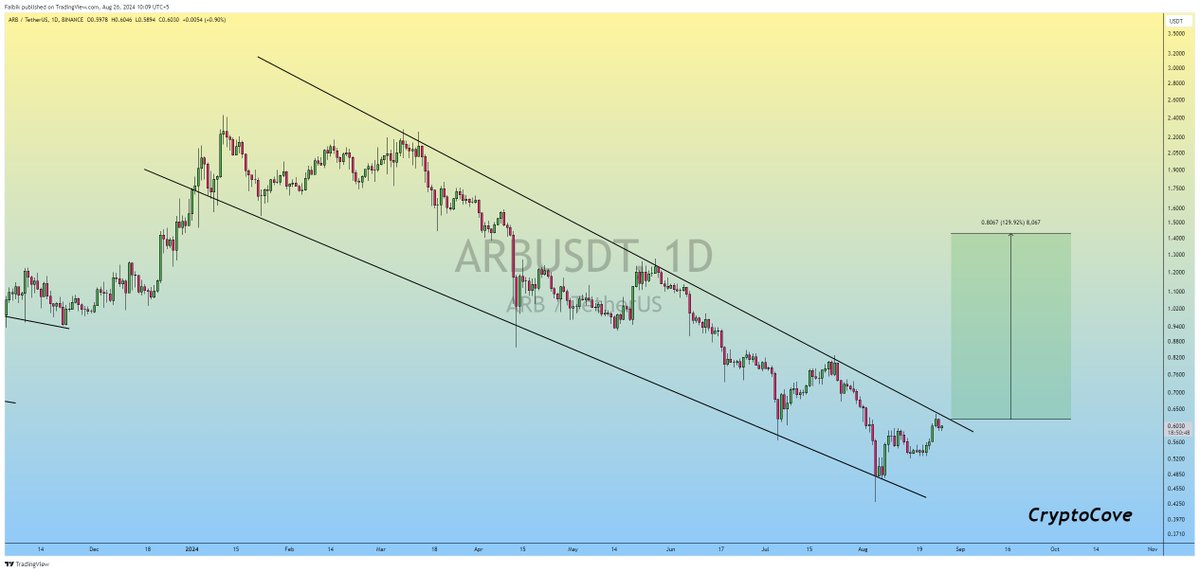
“$ARB is currently moving within a Descending Channel. It now appears to have Bottomed out and is on the verge of a Breakout. If it Successfully breaks out, we could see a 2x Bullish Rally in 2-3 months.”
This potential breakout is being closely monitored by traders, as it could mark a significant shift in ARB’s price trajectory.
ARB has been trading within a descending channel since March 2024, characterized by lower highs and lower lows. The price has consistently adhered to the channel boundaries, showing a clear downtrend.
However, recent movements suggest that ARB may be attempting to break out of this pattern.
Source: X
Bollinger bands tighten: Breakout imminent?
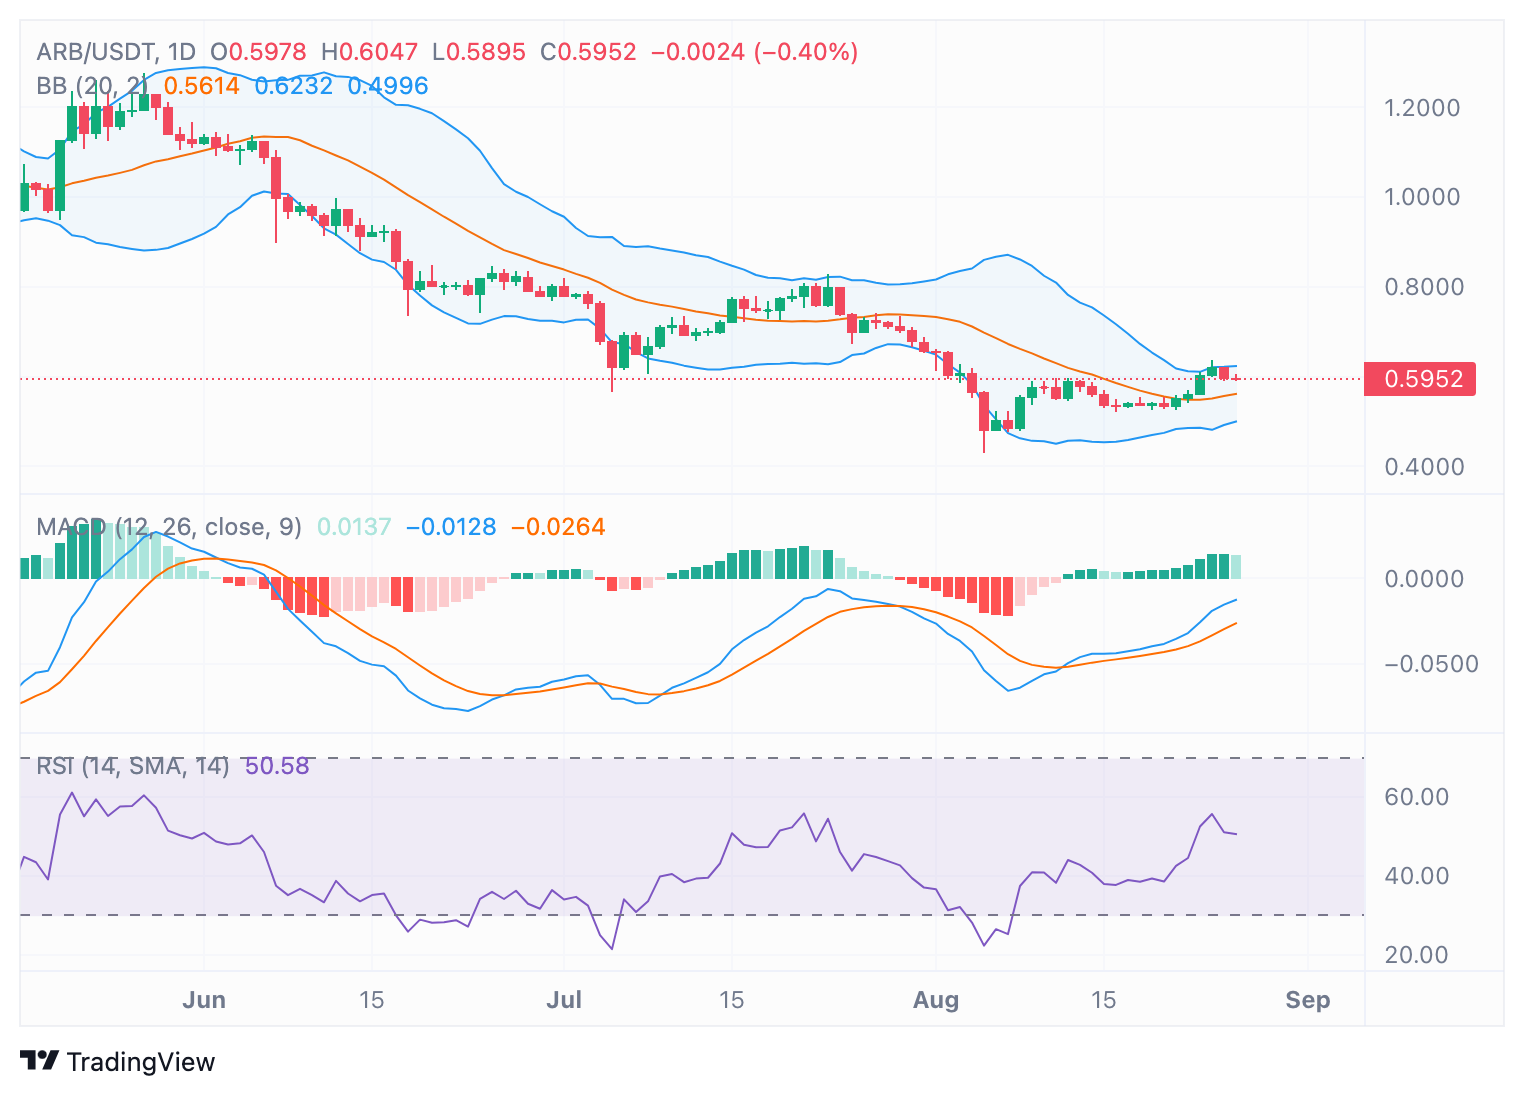
ARB/USDT chart reveals that the price is currently trading near the middle Bollinger Band, indicating consolidation following a recent downtrend.
The narrowing of the Bollinger Bands points to reduced volatility, which may signal an impending breakout as the price nears the upper band around $0.62.
Further supporting this outlook, the MACD has shown a bullish crossover, with the MACD line moving above the signal line.
This suggests potential upward momentum; however, the small positive bars in the histogram indicate that the strength of this momentum is still weak and requires further confirmation.
Source: TradingView
Meanwhile, the RSI (Relative Strength Index) hovers around 50, reflecting market indecision. A move above 60 could indicate a shift towards bullish momentum, while a drop below 40 might suggest renewed selling pressure.
ARB holders suffer as breakout looms ahead
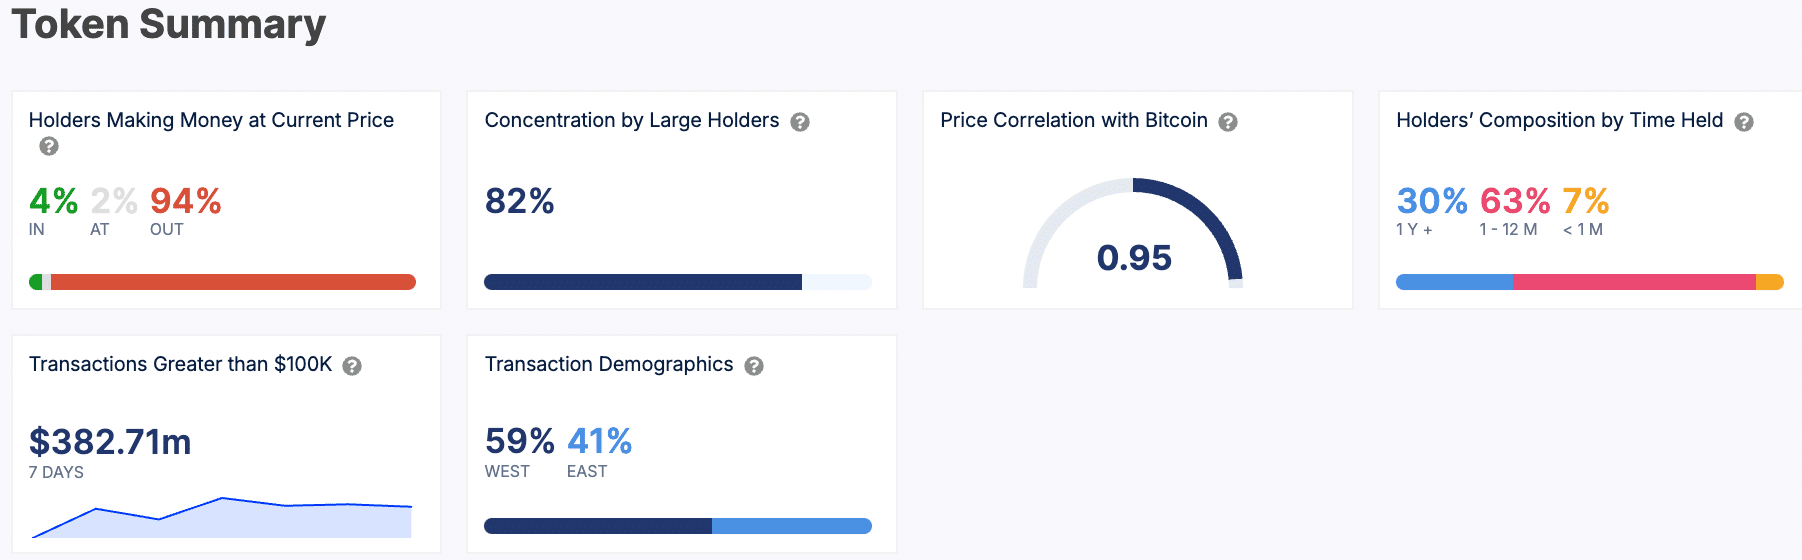
Despite these technical indicators, broader market sentiment appears cautious. According to data from IntoTheBlock, 94% of ARB holders are currently at a loss, with only 4% profiting at the current price.
Large holders, who control 82% of the total supply, dominate the market, which could influence price movements.
The token also shows a strong correlation with Bitcoin, with a correlation coefficient of 0.95, suggesting that ARB’s price may continue to follow Bitcoin’s trends closely.
Source: IntoTheBlock
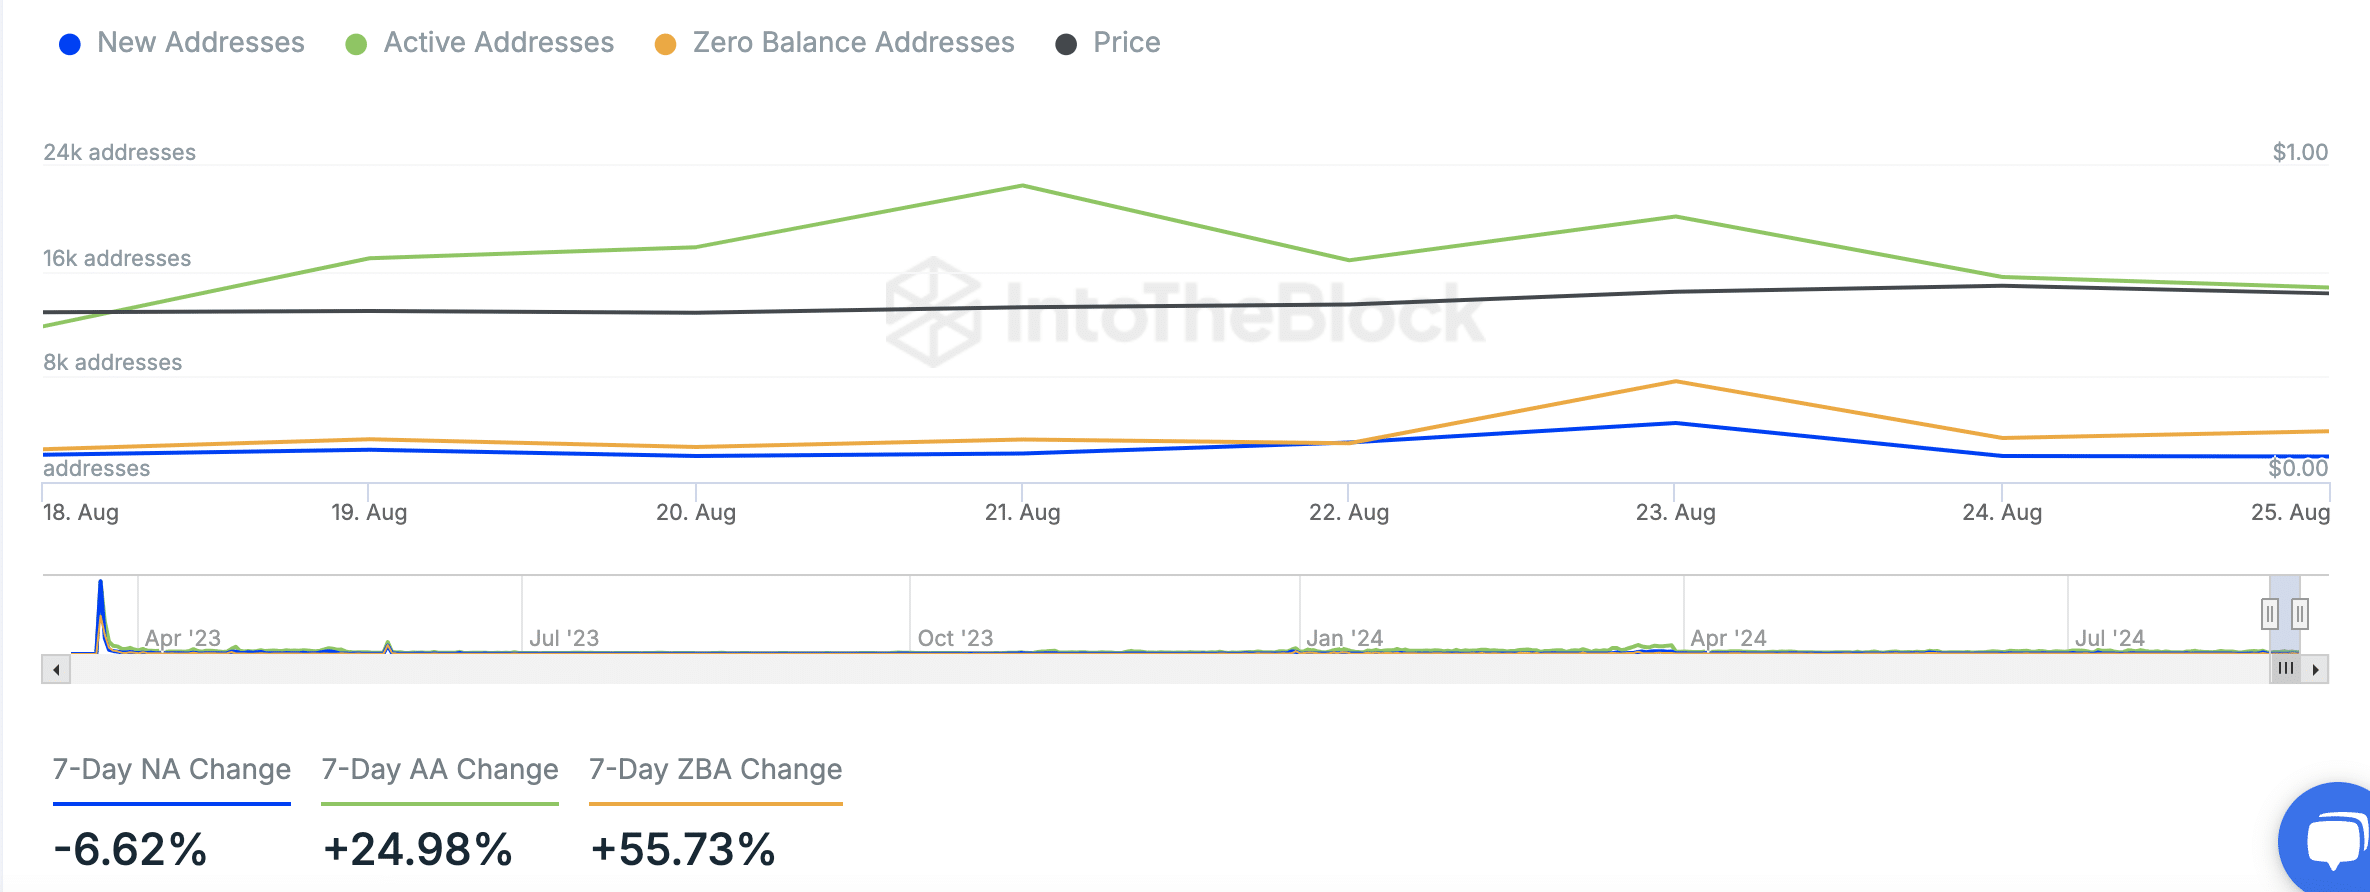
Over the past week, the number of new addresses has decreased by 6.62%, while active addresses have risen by 24.98%, indicating growing user engagement.
However, the number of zero-balance addresses has surged by 55.73%, which could point to an increase in inactive or abandoned accounts.
Source: IntoTheBlock
As ARB trades at $0.5977, market participants are keenly watching for signs of a breakout from the descending channel.