Will Bitcoin sink towards $50k? THIS signals more losses
After a strong trend, prices need time to consolidate, but Bitcoin has likely not concluded its downtrend yet.
- Bitcoin has an HTF bullish outlook, but the current retracement could go deeper.
- The ETF inflows temporarily buoyed bullish spirits.
Bitcoin [BTC] turned bearish on the lower timeframe price charts after racing to $65.5k at the start of the week on Monday, the 6th of May.
The $63.3k support level caved to the selling pressure and was flipped to resistance on the 7th of May.
Reports of a decline in the accumulation of BTC could see further depreciation due to a lack of demand. Yet, the outlook remained bearish for Bitcoin despite promising inflows on Monday.
The $62.1k level falters as the downtrend gathers strength
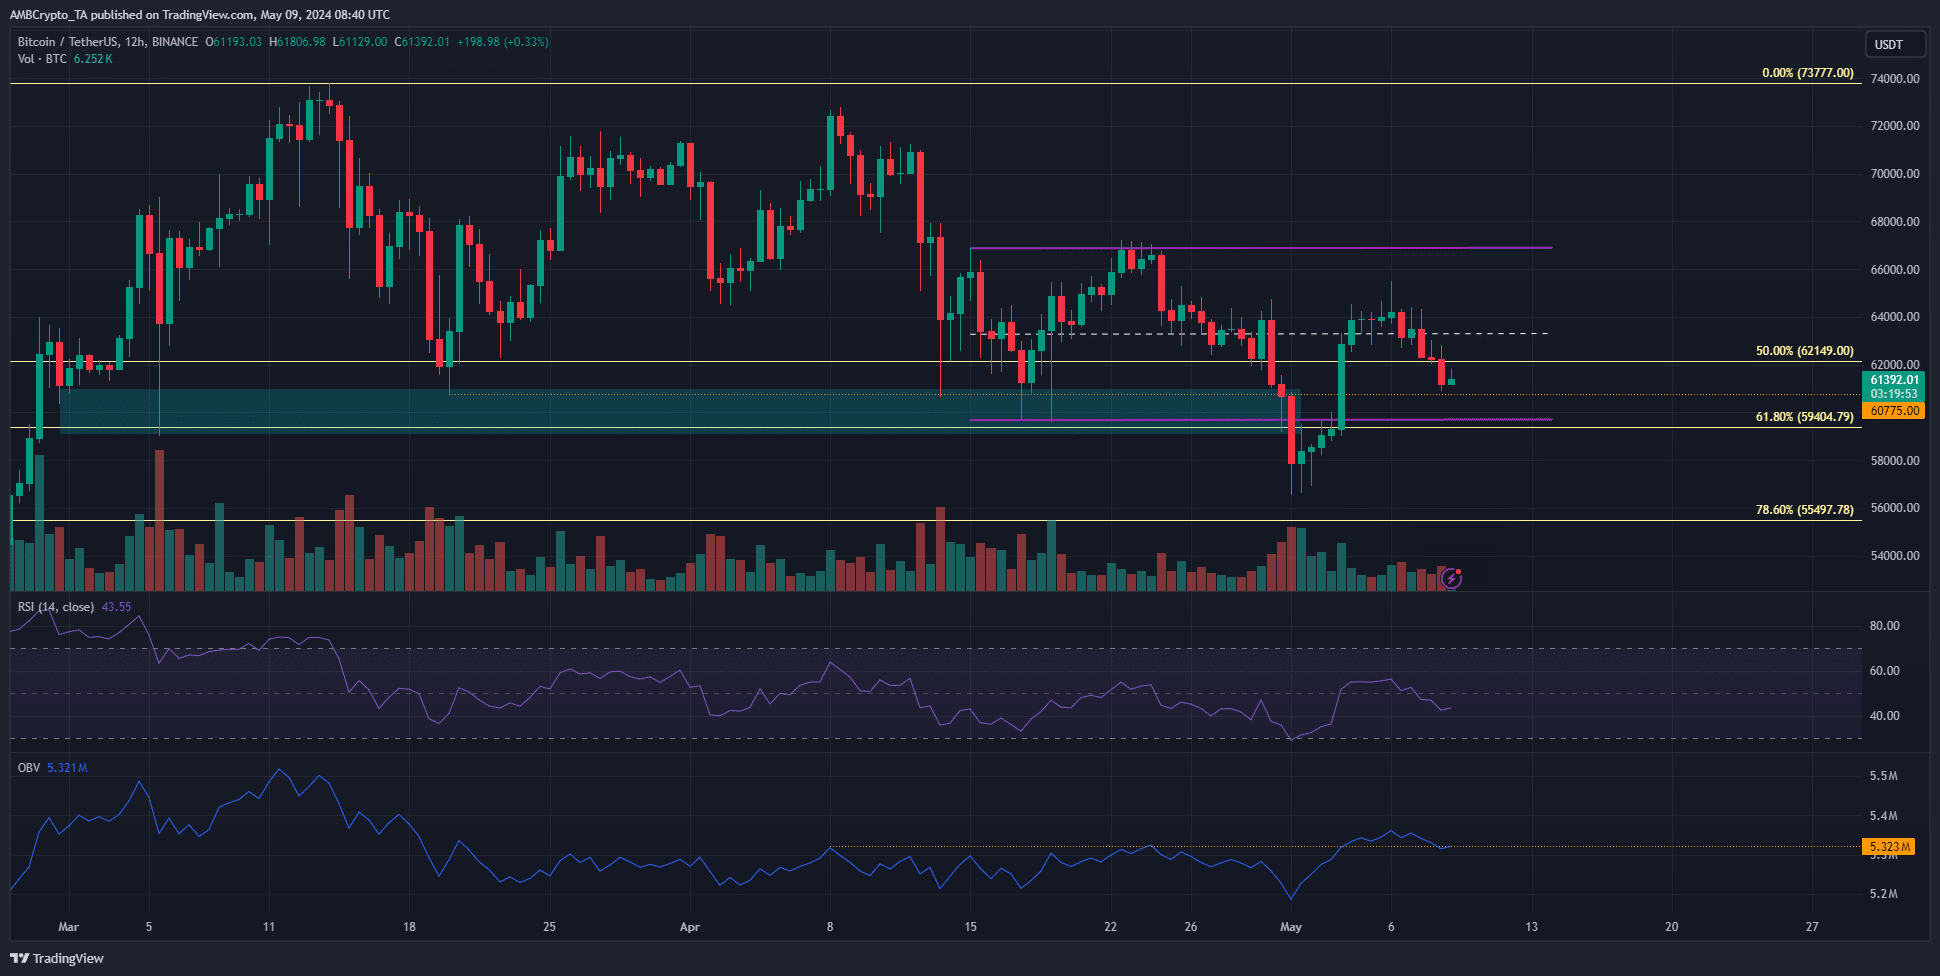
The range that BTC was previously trading within had its lows at $59.7k. The price action on the 1st of May saw this level breached, and the $65k region retested as resistance.
This meant that the market structure was bearish.
The RSI on the daily timeframe also fell below neutral 50 to indicate bearish momentum. Conversely, the OBV leaped above a local resistance level and continued to defend it at press time.
However, it was likely that Bitcoin would slump toward the $55k low or further downward in the coming weeks.
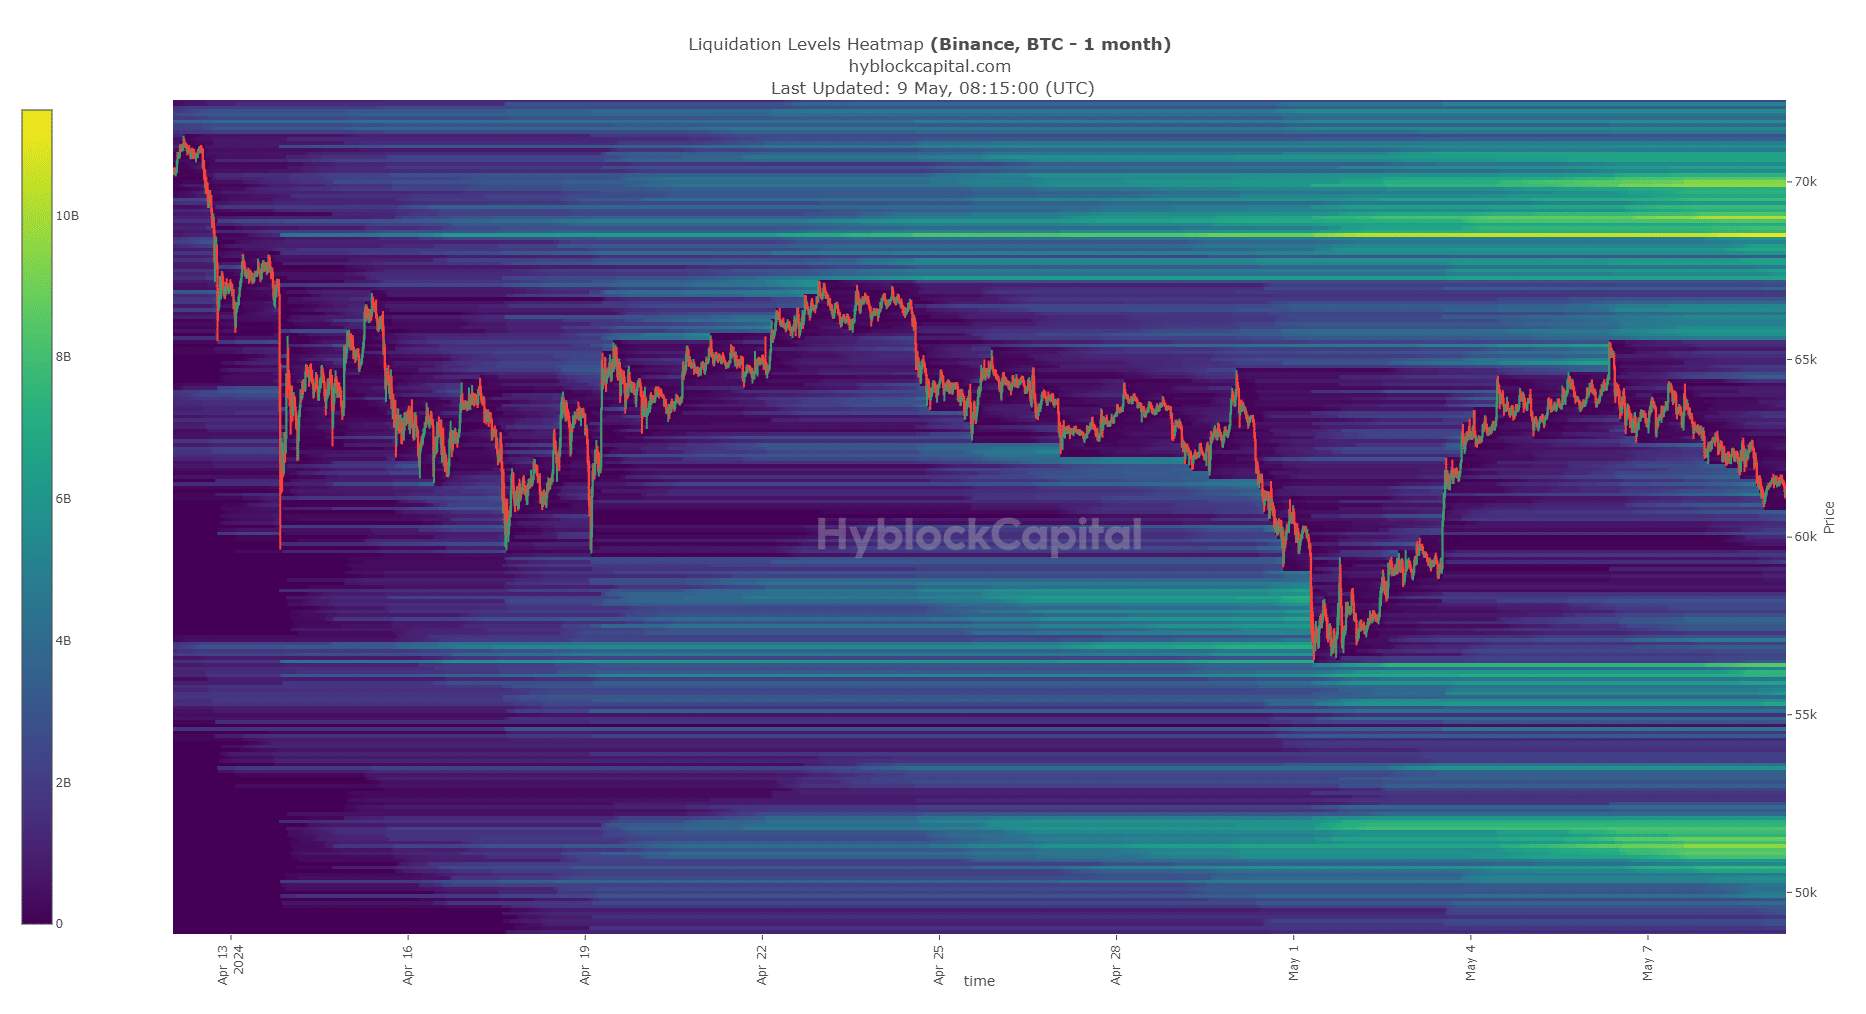
In the past two months, selling pressure has been intense, and the liquidity to the south could attract prices lower.
Why Bitcoin can not bullishly reverse instantly
The technical outlook highlighted a bearish bias. After a strong trend, prices need time to consolidate.
By breaking below the range low at $59.7k, BTC hinted that the consolidation phase was not yet upon us and that the downtrend persisted.
Read Bitcoin’s [BTC] Price Prediction 2024-25
The liquidity pockets at $56k and $51.5k are the next magnetic zones for Bitcoin. To the north, the $68.5k-$70k region was an interesting place for a bearish reversal.
Given the technical factors, a move southward appeared more likely.
Disclaimer: The information presented does not constitute financial, investment, trading, or other types of advice and is solely the writer’s opinion.